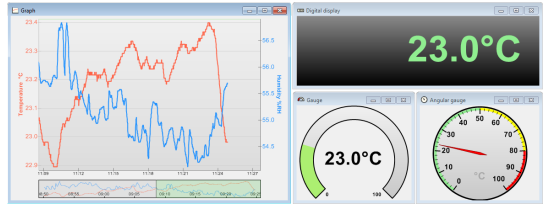
![]() One year ago, we offered you the Yocto-Visualization application, which enabled you to display in a few clicks the value of Yoctopuce sensors as graphs and gauges. This week, we revise the concept from top to bottom with version 2...
One year ago, we offered you the Yocto-Visualization application, which enabled you to display in a few clicks the value of Yoctopuce sensors as graphs and gauges. This week, we revise the concept from top to bottom with version 2...
Why a version 2?
Yoctopuce business model consists in selling USB sensors and actuators and in offering libraries enabling you to exploit them in most programming languages. We don't offer turnkey solutions, it's up to the customers to integrate our components in their solutions. But confronted to the increasing demand for a simple way to display the values of Yoctopuce sensors, we ended up accepting to develop a dedicated application.
However, at the time, we didn't want to invest heavily in the development of a C# graph rendering library. You could think that it's just a matter of drawing a few lines, but drawing a decent graph is infinitely more complex than it looks, to the point that some make it their own business and manage to live of it. Therefore, we decided to use a third-party library. After reviewing a few available C# libraries, we selected the one that seemed the most mature to us.
Unfortunately, after a while, we noticed that the said library had serious scalability issues. Starting from a few tens of thousands of dots, it slows down to the point that it becomes unusable. So even if one maintains a reasonable 1Hz sampling rate, one may very quickly reach the limits of the system: there are 86400 seconds in a single day.
To make it short, knowing that a) you are never better served than by yourself, and b) it's easier to correct your own bugs than to work around that of others, we finally decided to develop our own graphic rendering library. The Yocto-Visualization V2 application is the outcome of this development.

The rendering engine was rewritten from scratch
Okay, so what changes then?
There are multiple advantages to this new version:
Speed
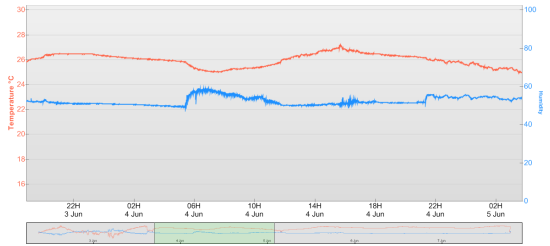
It can display graphs containing up to one million of dots without significatively slowing down.

Displaying an experiment extending over several days? Not an issue!
Orthogonality
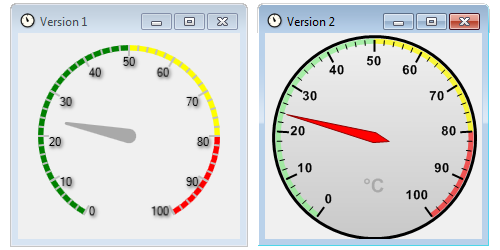
While we were at it, we also revamped the other widget types: "gauges", "angular gauges", and "digital display" now share the same types of parameters, which was far from being the case before, in particular for the choice of character fonts.

Angular gauge: version 1 and version 2
Color management
Version 2 offers a much improved color management: alpha-transparency is now supported and above all you now have a color definition interface which enables you to make your choice in the RGB space, in the HSL space, and in a predefined color list. It even remembers the latest colors that you have selected in order to allow you to find them again quickly.

A new interface to select colors
More parameters
You now have many more parameters than before to configure the different widgets given your preferences and your needs.
Screen capture
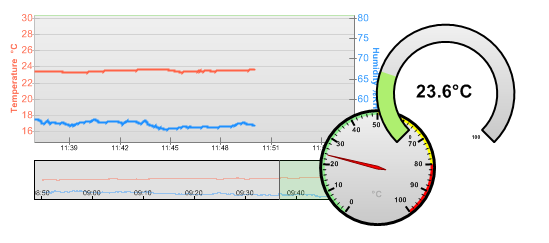
Version 2 contains an embedded screen capture system able to save a widget in the clipboard or in a PNG file. This enables you to conduct experiments and to copy/paste the results directly in your reports. In fact, it's not truly a capture: internally, the widget content is literally redrawn to a size predefined in the application configuration before being saved. Thus, no more issues with approximative size and resolution in your documents.

Copy/paste in your documents made easy
I'm going to loose my widget config!
Not really. The cost of all these improvements is that indeed the V2 configuration file is absolutely not compatible with the V1. But we anticipated the issue: V2 can read V1 files. In fact, the first time you run the V2, it looks on your computer for a V1 configuration and it offers you to import it. We don't promise a conversion perfect to the pixel, but the general look and feel should remain.
Well, well, and how much does that cost?
At a time when more and more software publishers switch to the subscription model, Yoctopuce remains true to its principles: not only is the Yocto-Visualization V2 offered for free, but you can also find the complete source code on GitHub.
Where do I find the installation file?
Simply on our Support / tools page.
You forgot Linux / MacOS-X users again!
Believe it or not, but we made some experiments and we think that we should be able to recompile the Yocto-Visualization V2 for Linux and Mac OS-X thanks to Mono and Xamarin. We'll keep you posted.
edit July 2018, 7th: there is now a Linux version available.


