![]() Yoctopuce sensors are sold with programming libraries rather than with turnkey software for a specific use. Therefore, most of Yoctopuce users are developers. We do provide a few ready-to-use tools such as the command line interface, somewhat rustic, or the integration into third party solutions such as EmonCMS or Valarm. Today, we present a new solution of this type: an integration with InfluxDB and Grafana.
Yoctopuce sensors are sold with programming libraries rather than with turnkey software for a specific use. Therefore, most of Yoctopuce users are developers. We do provide a few ready-to-use tools such as the command line interface, somewhat rustic, or the integration into third party solutions such as EmonCMS or Valarm. Today, we present a new solution of this type: an integration with InfluxDB and Grafana.
InfluxDB is a database specifically dedicated to store time series of measures and events. It is very efficient to retrieve measure series for a given time range, even when averaging on-the-fly. It has an HTTP interface to insert the data, and the latest version of the VirtualHub and of the firmware of the YoctoHub-Ethernet and YoctoHub-Wireless-g/SR enable you to post measures by HTTP callback.
Grafana is a very powerful web interface to visualize time series of measures as graphs. You can connect it to several data sources, including InfluxDB, and extract in a few clicks dynamic graphs that you can then personalize and organize in a dashboard.
Installation
As this post was first destined for non-developers, we hoped to illustrate it with an installation under Windows. Unfortunately, InfluxDB is not available for Windows right now, even if it should come presently... Therefore, we are going to show you how it works on a Linux 64 bits (AMD64) machine, for which there are easy-to-install pre-compiled binaries.
A description of how to install InfluxDB is available here: you need only one command to download the package and another one to install it with the package manager. Then, don't forget to start the InfluxDB service before you go on, with the command:
sudo service influxdb start
When the service is running, you can open a web browser on http://127.0.0.1:8083 to connect to the management console, and you should obtain a page looking like this:

InfluxDB web console
As shown on the screen shot above, enter the command to create a database with the name of your choice (you can get help from the Query Templates drop-down).
Sensor configuration
When you have created the database, you can configure your VirtualHub or your YoctoHub-Ethernet/Wireless to send its data directly in the database. Connect to its web interface, where the available sensors are listed:
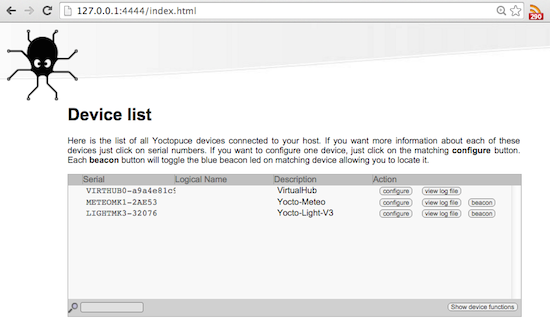
VirtualHub web console
To navigate more easily among your sensors, we recommend that you start by assigning logical names to your modules, by clicking on the configure button close to each one. Below, we assign the name inside to a Yocto-Meteo measuring the environment inside our office:
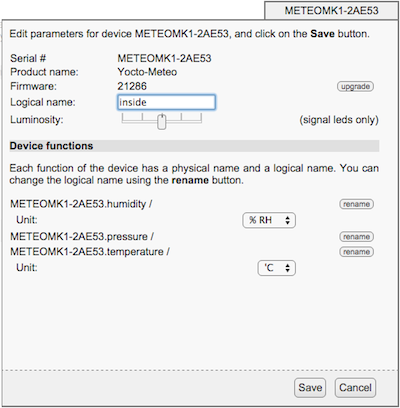
Configuring the Yocto-Meteo
You can then point the hub to your database, by clicking on its configure button. In the configuration window that opens, find the line saying Callback URL: and click on the edit button. You obtain the HTTP callback configuration window. In the first drop-down menu, select InfluxDB and you can enter all the necessary parameters:
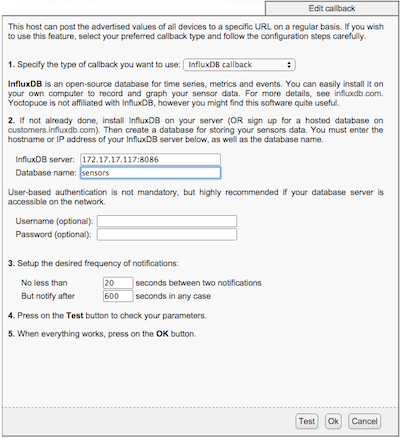
Configuring HTTP callback to InfluxDB
Note: If InfluxDB is not available in the drop-down, it means that your VirtualHub or the firmware of your module is not recent enough: update it. Make sure to specify the name of the database that you have created and click on the Test button at the bottom of the window. If everything goes according to plan, you simply obtain the following message:
[Connection closed]
Close the window, click Save and you are done.
Installing and configuring Grafana
To view the measures, you need now to install Grafana. You can find the instructions here, it's very simple. Under Debian, if you open the .deb file, you can run the setup directly with the graphical interface. When Grafana is installed, you must launch it, like InfluxDB, with the command:
sudo service grafana-server start
The management console is then available on http://127.0.0.1:3000 and you should obtain a page looking like this:
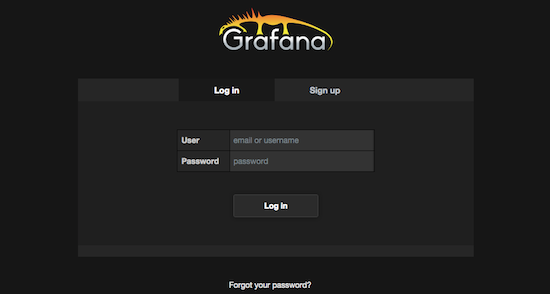
Grafana login window
The default login is admin, with password admin. You can change it later. When connected, you obtain your dashboard, very empty so far. The first thing to do is therefore to configure a data source, normally your InfluxDB database. So, click on Data Sources, then Add new on top. Point to your InfluxDB server, making sure to specify that this is the default database server, running InfluxDB version 0.9, and that it can be reached on port 8086:
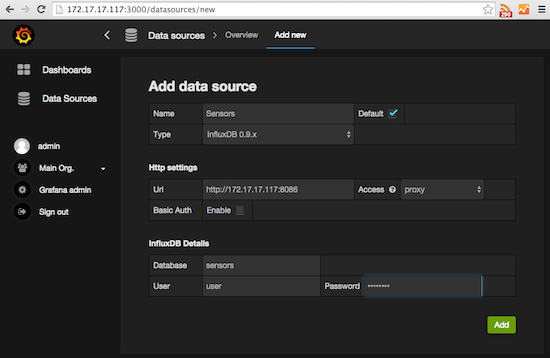
Configuring the data source
When everything is filled in, click on the Add button.
Displaying the measures in Grafana
What's left to do is only to create your first dashboard and select the measures to be displayed. To do so, click on the Home menu, which contains the list of the dashboards, and select the +New option at the very bottom. Then, get the mouse close to the little green rectangle to bring up the hamburger menu enabling you to add a graph.

Menu to add a graph
The added graph does not yet contain data, you must still select what you want to display. To do so, click on the graph title, where it is written (click here), and click the Edit button which is then available. You obtain your graph configuration interface:
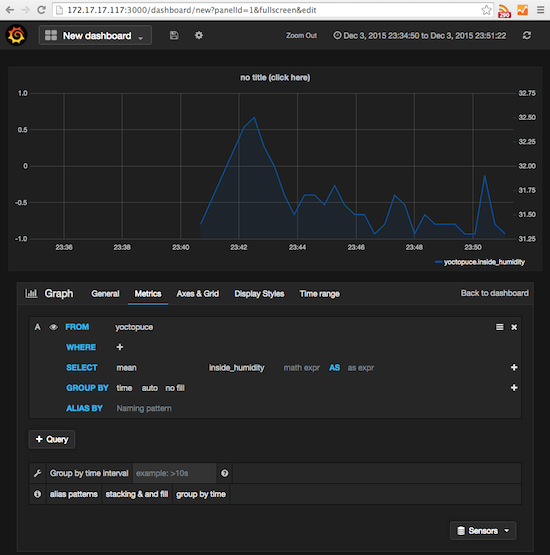
Configuring a graph
- Click on select measurement and select yoctopuce: it is under this name that the measures are always stored.
- Click on value and select for example inside_humidity
- Click on +Query to add another serie to the same graph: inside_temperature, ...
- Click on the cross on the top right corner of a serie that you want to remove
At this point, your data should already start being displayed. You can still go on the General tab to modify the title of the graph. If you want to use a distinct Y scale for one of the measures, click on its small color line in the graph legend and then on the button labelled right: it will move it to the right scale.
When you are satisfied with your graph, click on Back to dashboard, then press Ctrl-S or click on the diskette icon to save your dashboard. You can repeat the operation to add other graphs either side-by-side to the first one, or below it with the ADD ROW button on the lower right. You can thus obtain a pleasing personalized control interface which you can extend at will....
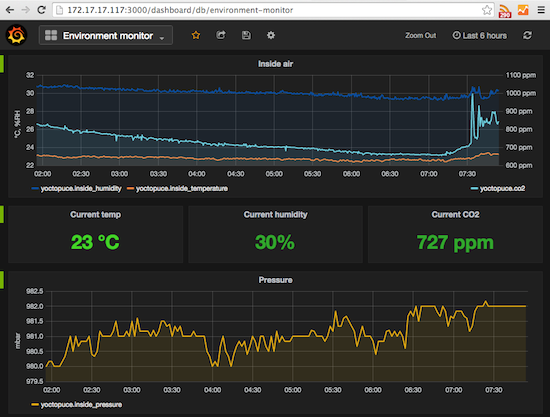
Full dashboard
A last piece of information: for this post, we also tried to install InfluxDB on a Raspberry Pi. Unfortunately, there is no pre-compiled package for the Raspberry Pi, and the compilation from the sources following the instructions found on the web didn't work for us. Too bad...


