![]() A few years ago, we showed you how to integrate Yoctopuce sensors in a Grafana dashboard used with InfluxDB, which was a very common solution at the time. In the mean time, GrafanaLabs has set its sights on another time-series database, Prometheus, which offer many more possibilities to extract data than InfluxDB. We have therefore added to our modules the possibility to provide their data in a format directly recognized by Prometheus.
A few years ago, we showed you how to integrate Yoctopuce sensors in a Grafana dashboard used with InfluxDB, which was a very common solution at the time. In the mean time, GrafanaLabs has set its sights on another time-series database, Prometheus, which offer many more possibilities to extract data than InfluxDB. We have therefore added to our modules the possibility to provide their data in a format directly recognized by Prometheus.
Prometheus / Grafana 's target scenario
Before going into details, let's clarify that Prometheus and Grafana are not designed to provide a real time visualization of sensor data, second by second. To do this, we recommend rather Yocto-Visualization, which will be easier to implement and more responsive.
The true aim of Prometheus is to periodically collect hundreds of measures issued from multiple sources, to store them, to query them efficiently, and to potentially trigger alarms. Grafana then allows you to visualize the measure history on a given time range to detect and analyze abnormal situations.

Architecture of a Prometheus system
Implementation
In the opposite to InfluxDB, Prometheus works by polling: it is the Prometheus server which periodically contacts the sources to collect the measures at the selected frequency, and not the sources which spontaneously post their measures in the data base. This choice implies that you need in any case to install you own Prometheus server on your local network, so that it can access your data sources and your sensors. You can then synchronize your local Prometheus server with a Cloud service, but the data collection must be performed by a local server.
Prometheus data sources are called exporters: the idea is that each important system or service can make its vital data available to Prometheus, enabling the system administrator to collect and monitor them. Each exporter is an HTTP accessible URL, which provides data following the OpenMetrics standard: one measure per line, with conventions for naming and classifying, enabling the system administrator to find his/her way among the hundreds of measures at disposal when configuring the dashboard.
To get the best possible integration with Prometheus, we have built into Yoctopuce devices and into the VirtualHub software the capability to be native OpenMetrics exporters. Up to now, Yoctopuce modules could export their measures in the following formats: JSON, XML, and simple text, via a REST interface described in more the documentation in the chapter titled Using with unsupported languages. This same REST interface now enables you to obtain data in the OpenMetrics format by using the .om file extension. For example, if you load the /api/services.om URL on a YoctoHub-Ethernet, you obtain something akin to this (we modified the presentation to make reading easier, but in reality each measure fits on a single line):
productName="Yocto-Thermocouple",
serialNumber="THRMCPL1-16397A",
deviceName="insideProbes",
functionId="temperature1"} 21.78
yocto_temperature_advertisedValue{
productName="Yocto-PT100",
serialNumber="PT100MK1-BA496",
functionId="temperature"} 28.57
yocto_temperature_advertisedValue{
productName="Yocto-RangeFinder",
serialNumber="YRNGFND1-1D1567",
deviceName="rf",
functionId="temperature1",
functionName="rfTemp"} 25.13
yocto_lightSensor_advertisedValue{
productName="Yocto-RangeFinder",
serialNumber="YRNGFND1-1D1567",
deviceName="rf",
functionId="lightSensor1"} 56
yocto_rangeFinder_advertisedValue{
productName="Yocto-RangeFinder",
serialNumber="YRNGFND1-1D1567",
deviceName="rf",
functionId="rangeFinder1"} 1456
# EOF
To tell Prometheus to collect these data directly from your YoctoHub-Ethernet, you must add to your prometheus.yml a file section of this type:
scrape_interval: 60s
metrics_path: "/api/services.om"
static_configs:
- targets: ['192.168.0.100:4444']
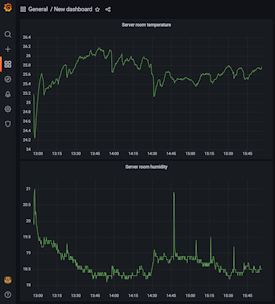
And here is the kind of graph that you can get from Yoctopuce sensors in Grafana:

Temperature measurements in Grafana
Advanced usage
As our OpenMetrics exporter is embedded straight into the REST interface, you can use it to obtain more detailed information for each sensor. For example, if you assign to a Yocto-Thermocouple the logical name tcProbes amd that you query the URL /byName/tcProbes/api.om URL, you obtain something like:
yocto_module_beacon{...,functionId="module",functionName="tcProbes"} 0
yocto_module_usbCurrent_mA{...,functionId="module",functionName="tcProbes"} 23
yocto_module_rebootCountdown{...,functionId="module",functionName="tcProbes"} 0
yocto_module_userVar{...,functionId="module",functionName="tcProbes"} 0
yocto_temperature_currentValue_degC{[...],functionName="heatSink"} 21.99
yocto_temperature_lowestValue_degC{[...],functionName="heatSink"} 20.51
yocto_temperature_highestValue_degC{[...],functionName="heatSink"} 22.25
yocto_temperature_currentRawValue_degC{[...],functionName="heatSink"} 21.988
yocto_temperature_signalValue_mV{[...],functionName="heatSink"} -0.162
yocto_temperature_signalValue_mV{[...],functionId="temperature2"} 999.999
yocto_dataLogger_currentRunIndex{[...],functionId="dataLogger"} 0
yocto_dataLogger_autoStart{[...],functionId="dataLogger"} 0
yocto_dataLogger_beaconDriven{[...],functionId="dataLogger"} 0
yocto_dataLogger_usage{[...],functionId="dataLogger"} 0
# EOF
Thus, all the numerical attributes are made available. You can therefore know the min/max values encountered, the voltage measured at the thermocouple terminal, and so on. Note also that in this case, the exported symbol includes the unit, as recommended by OpenMetrics. When the module detects that an input is not connected (like the temperature2 function above), metrics that cannot be computed are automatically deleted from the export so that Prometheus reports them as missing, rather than keeping the latest measured value.
To obtain these additional data per sensor, simply add to the prometheus.yml file a new section, referencing the sensor either by its serial number (bySerial) or by its logical name (byName):
scrape_interval: 60s
metrics_path: "/byName/tcProbes/api.om"
static_configs:
- targets: ['192.168.0.100:4444']
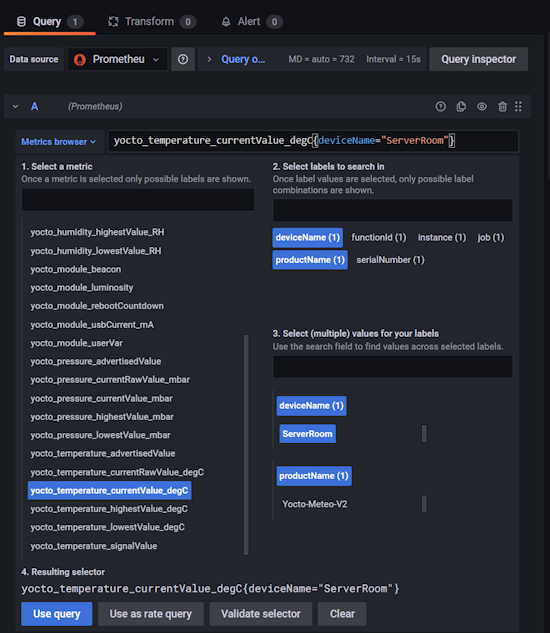
Here is the corresponding metrics selection interface in Grafana Web UI, for a Yocto-Meteo-V2:

Choice of Yoctopuce metrics for a Yocto-Meteo-V2 ambient sensor
Availability
As of today, we have published new firmware for the YoctoHub-Ethernet, the YoctoHub-Wireless-n and a new VirtualHub with support for the OpenMetrics format, which enables you to immediately implement the basic usage. To obtain detailed data by sensor, you will also need to update the firmware of all the sensors. We have already published new firmware for a dozen of devices, and the other modules will follow gradually, as the firmware are validated. You can recognize a firmware with OpenMetrics support by its firmware level, which should be greater than 48000. If you need a particular one urgently, don't hesitate to contact Yoctopuce support!


