 This week we will illustrate the use of PHP with our USB sensors on a very classical example: recording weather parameters (temperature and humidity). Nothing really special, but this very basic example demonstrates the advantage of easily accessing USB modules from a language like PHP. Thanks to the numerous libraries and ease of use of the language, real-world application can be built real fast.
The goal of this project is to build a real-time graph showing temperature and humidity for a given time period, as in the example below. Of course, we also want to store data in a database for processing them later if needed.
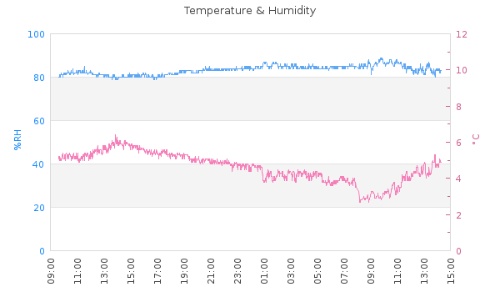
This is what we want to get in real time
In order to do so, we will use a Yocto-Humidity sensor of course, connected to a PC on which we have installed a Web server with PHP. In our case, we used EasyPHP, but MAMP on Mac OS X would have done as well.
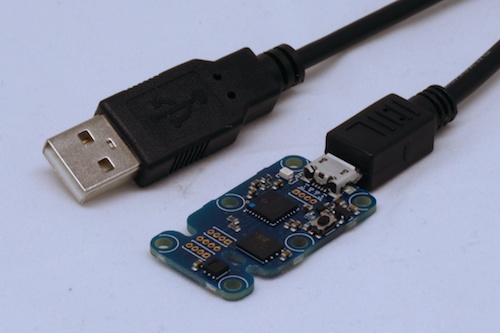
Yocto-Humidity: a micro-weather measurement station
On the software side, there will be two parts: the code that periodically measures the parameters and stores the values in the database, and the code that dynamically creates the graph on demand.
To read the sensors from PHP, we start a small PHP script in command line. Few people bother to use PHP in this way, although it is actually a very convenient language to execute small scripts running within an OS. On Windows, if you have installed EasyPHP or a similar environment, you will find the php.exe executable somewhere under Program Files, and you just have to start it with the name of your PHP script as argument. Here is the script that reads the sensors and stores the values in the MySQL database:
include("yocto_api.php");
include("yocto_temperature.php");
include("yocto_humidity.php");
function mysql_check($what,$retval)
{ if(!$retval) die("MySQL error ($what): ".mysql_error()); }
$conn = mysql_connect('localhost','db_username','db_password');
mysql_check('connect', $conn);
$res = mysql_select_db('weather');
mysql_check('select_db', $res);
yRegisterHub('http://127.0.0.1:4444');
while(TRUE) {
$temp = yFirstTemperature()->get_currentValue();
$hum = yFirstHumidity()->get_currentValue();
Print("Temperature: $temp C\n");
Print("Humidity: $hum %RH\n");
$time = time();
$time -= $time % 60;
$res = mysql_query("select * from meteo where timestamp=$time");
mysql_check('select', $res);
if(mysql_num_rows($res) == 0) {
mysql_query("insert into meteo (timestamp,temperature,humidity)".
" values ($time,$temp,$hum)");
}
sleep(20);
}
?>
After initializing the connection to MySQL database 'weather' (must be created first, using phpMyAdmin for instance), this code will read the sensors and store the values in the database using as timestamp the current date and time (function time()), rounded to the minute. We don't store more than one measure per minute, even though the measure loop itself runs every 20 seconds.
To display the result, we use a very standard web page, but linking an image that will be dynamically generated in PHP. We use one of the various graph libraries available for PHP on the web, namely jpGraph since it is the one that Google gave us first today...
$conn = mysql_connect('localhost','db_username','db_password');
mysql_check('connect', $conn);
$res = mysql_select_db('weather');
mysql_check('select_db', $res);
// featch measures from the last 48h
$lastday = time() - 2*86400;
$query = "select * from meteo where timestamp>=$lastday order by timestamp";
$res = mysql_query($query);
mysql_check('select', $res);
$time = Array();
$temp = Array();
$hum = Array();
while ($row = mysql_fetch_array($res)) {
$time[] = $row['timestamp'];
$temp[] = $row['temperature'];
$hum[] = $row['humidity'];
}
// draw graph
chdir("../jpgraph");
include_once ("jpgraph.php");
include_once ("jpgraph_line.php");
include_once ("jpgraph_date.php");
$tplot = new LinePlot($temp,$time);
$hplot = new LinePlot($hum,$time);
$graph = new Graph(600,350);
$graph->title->Set('Temperature & Humidity');
$graph->SetMargin(60,60,40,50);
$graph->SetMarginColor('white');
$graph->SetScale('datlin',0,100);
$graph->Add($hplot);
$graph->SetY2Scale('lin',0,12);
$graph->AddY2($tplot);
$graph->xaxis->SetLabelAngle(90);
$graph->xaxis->scale->SetDateFormat('H:i');
$graph->yaxis->SetColor('dodgerblue');
$graph->yaxis->title->SetColor('dodgerblue');
$graph->yaxis->title->Set('%RH');
$graph->yaxis->title->SetAngle(90);
$graph->yaxis->title->SetMargin(10);
$graph->y2axis->SetColor('hotpink3');
$graph->y2axis->title->SetColor('hotpink3');
$graph->y2axis->title->Set('░C');
$graph->y2axis->title->SetAngle(90);
$graph->y2axis->title->SetMargin(10);
$graph->Stroke();
?>
That's it for the programming side, the project is ready to run. Except that... if we intend to measure the outside temperature and humidity, we better plan to somewhat shield the hardware from bad weather. Luckily, the sensor itself can be detached from the USB controller and moved away using regular ribbon cable. This makes it easier to keep the most sensitive part of the hardware inside. For this project, we have used a 4m ribbon cable.
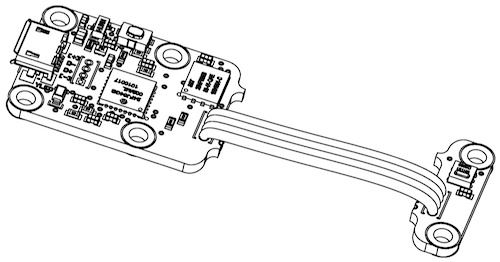
The module is designed to make it possible to move away the sensor
Now we only have to provide a minimal protection to the sensor itself. In this case, the tropicalization method described some weeks ago is unfortunately not applicable, as the tropicalisation spray would damage the humidity sensor. We will therefore fallback on a more classical protection technique, and build a small sensor protection enclosure:
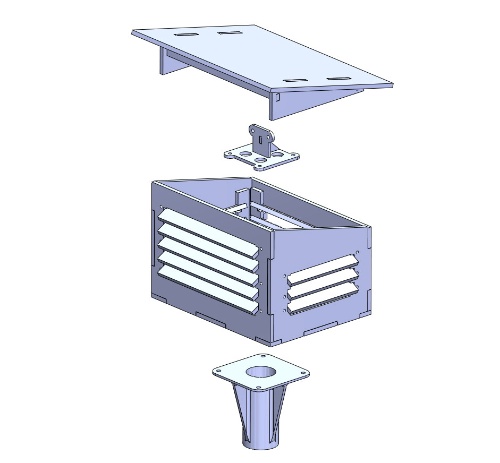
A small protection enclosure for the sensor
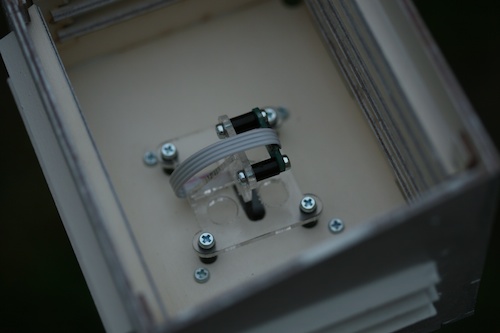
The sensor in its box, mounted vertically
Here we go! Now you can go see by yourself the weather we have in Cartigny...
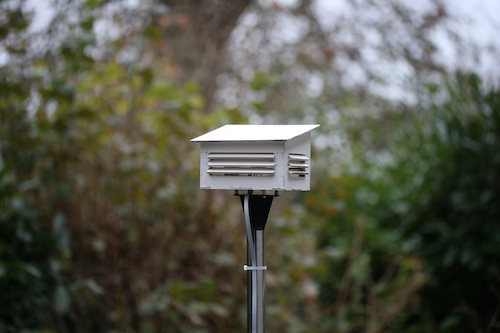
Yoctopuce weather station


