 As with the native version, one of the limitations of Yocto-Visualization (for web) is the maximum number of series that each graph can display, that is four. But, as with the native version, it is possible to increase this limit, at the cost of a small code modification. However, for the web version, the process of obtaining executable code is a little more complicated than pressing F6 in VisualStudio. Hence this week's post.
Getting started
First of all, check that Node.js is installed on your machine. If necessary, you can easily download it from the Node.js website.
Download the source code for Yocto-Visualization (for web). You'll find it on our "Tools" page or on GitHub. Don't get the wrong version: choose the "4web" version. The quickest way is to download the zip file, and unzip it on your disk, say in C:\tmp\YV4W. You'll notice that Yocto-Visualization (for web) is written in TypeScript.
 source code from GitHub")
Downloading Yocto-Visualization (for web) source code from GitHub
Editing the source code
Using your favorite editor, open the src/properties.ts file. Around line 2000, you'll find a succession of code blocks describing graph series. Here's the first one.
public get ATTR_Graph_series0__DisplayName(): string {return "Series 1"}
public get ATTR_Graph_series0__CategoryAttribute(): string {return "Data Sources"}
public get ATTR_Graph_series0__PreExpandedCategoryAttribute(): boolean {return true}
public get ATTR_Graph_series0__PreExpandedAttribute(): boolean {return true}
public get ATTR_Graph_series0__ReadOnlyAttribute(): boolean {return true}
public get ATTR_Graph_series0__DescriptionAttribute(): string {return "First data series, expand for more."}
public get Graph_series0(): ChartSerie { return this._Graph_series0 }
public set Graph_series0(value: ChartSerie) { this._Graph_series0 = value }
This block is repeated for _Graph_series1, _Graph_series2 and _Graph_series3, with a few variations for default values. To add a new series, simply add a similar block after the last one, changing index 0 to 4 and making a few constant adjustments, for example:
public get ATTR_Graph_series4__DisplayName(): string {return "Series 5"}
public get ATTR_Graph_series4__CategoryAttribute(): string {return "Data Sources"}
public get ATTR_Graph_series4__PreExpandedCategoryAttribute(): boolean {return false}
public get ATTR_Graph_series4__PreExpandedAttribute(): boolean {return false}
public get ATTR_Graph_series4__ReadOnlyAttribute(): boolean {return true}
public get ATTR_Graph_series4__DescriptionAttribute(): string {return "Fifth data series, expand for more."}
public get Graph_series4(): ChartSerie { return this._Graph_series4 }
public set Graph_series4(value: ChartSerie) { this._Graph_series4 = value }
You can add as many series as you like, as long as you respect the indexing logic. Don't forget to save your modification. The next step is to transform this TypeScript code into JavaScript so that it can be understood by a web browser. In other words, you need to compile it.
Compiling
Open a command line window, go to the directory where the tsconfig.json file is located, in this case C:\TMP\YV4W, and type the following command.
npm install
This downloads the few dependencies that Yocto-Visualization (for web) needs to compile, so you only need to use this command once. Then use the following command to compile everything:
npm run build
Once compiled, you'll find a whole series of files in the dist/es2017 directory. The two you're interested in are:
- yv4w-installer.html
- yv4w-installer.js
In theory, you'd just have to open yv4w-installer.html with your favorite web browser to launch the installer. Unfortunately, the CORS rules of modern browsers have become so strict that this won't work. That's why we've provided a little mechanism to launch the installation.
Installation method 1
Go to the directory containing the tsconfig.json file, and type the command:
npm run installer
This launches a small, temporary local web server which serves a web page containing the installer interface. However, depending on your browser and the configuration of the target server, the installer may not work, even after trying both HTTP and HTTPS modes. Hence the alternative installation method.
Installation method 2
If method 1 doesn't work, you need to copy the two installer files to the machine/server on which you want to install Yocto-Visualization (for web). But first, a little optimization could save you some time.
Optional optimization
Compress the files before uploading them to the target machine. This saves you a lot of transfer time, especially for YoctoHubs. You can then G-zip both files. Be careful not to use the wrong compression method: you should obtain .gz files and not .zip files at the end of the operation. You can use 7-zip for this. Be careful to keep the original extension. At the end of the compression operation, you should obtain the files:
- yv4w-installer.html.gz
- yv4w-installer.js.gz
To upload the files to your YoctoHub or VirtualHub, the easiest way is to use the file manager in the hubs' interface. For the purposes of this demonstration, we've used a normal VirtualHub launched with the -F option to provide a file system.

Use the hub file manager
Once both files are present on your target hub, all you have to do is launch the installer from your favorite browser. In this case, the URL is as follows, regardless of whether the file is compressed or not:
http://127.0.0.1:4444/yv4w-installer.html
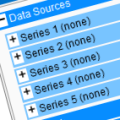
Once the installation is complete, you find yourself with a version of Yocto-Visualization (for web) that offers five series per graph instead of four.

More than four series per graph? Yes, it's possible.
Of course, once the installation is complete, you can delete both installation files.
Conclusion
It's not quite as simple as changing a configuration parameter, but it is indeed possible to change the maximum number of series per graph. In fact, this src/properties.ts file is used to define all the properties that can be modified by the Yocto-Visualization (for web) property editor. Including their default values.
Finally, you can find below a list of other posts referring to Yocto-Visualization (for web).
- Yocto-Visualization (for web) presentation.
- How to use the native version.
- Comparison of web and native versions.
- Integrating your own web page into Yocto-Visualization (for web).
- Integrating Yocto-Visualization (for web) into your own web page.

