 Welcome to the Yocto-VOC-V4-C, the successor to the Yocto-VOC-V3. Following the end of production of the Sensirion SGP30 sensor, we decided to base the USB Type-C version of the volatile organic compound ( VOC ) sensor on a new sensor, the ENS161 from Sciosense. As always, the Yocto-VOC-V4-C retains the same format and software interface as its predecessor. Existing applications therefore continue to work without modification. But as a little bonus, the Yocto-VOC-V4-C offers a new air quality index.
Overview
Aside from the USB Type-C connector, the Yocto-VOC-V4-C looks almost exactly like the Yocto-VOC-V3 because we simply replaced the Sensirion SGP30 sensor-which is no longer available-with a ScioSense ENS161 sensor. In addition to the VOC sensor, the Yocto-VOC-V4-C features a temperature and humidity sensor.
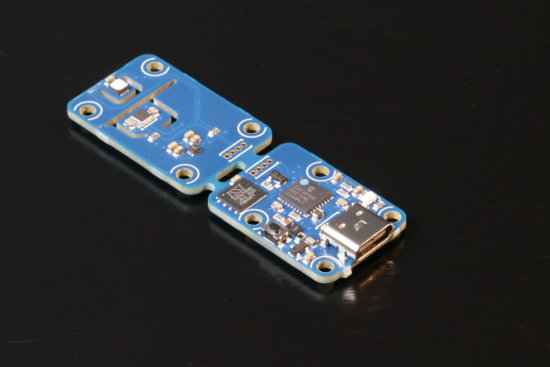
The brand-new Yocto-VOV-V4-C
Just like version 3, the Yocto-VOC-V4-C measures 60x20mm, and you can cut it in half to move the sensor section wherever you like.
A Small New Feature
The Yocto-VOC-V3 provides an estimated VOC (volatile organic compounds) value in CO2 ppm equivalents and an estimated TVOC (total volatile organic compounds) value in ppb to monitor indoor air quality. Although expressed in physical units, these values are in reality only estimates, they do not claim to be absolutely accurate. The new Yocto-VOC-V4-C, based on the ENS161 sensor, adds a new airQuality index that makes it easier to assess ambient air quality. It is available in two variants, depending on the module's configuration: the UBA index and the relative index.
The UBA AQI variant is based on absolute tVOC thresholds defined by the Umweltbundesamt (the German Federal Environment Agency). It provides a fixed classification of indoor air quality on a scale from 1 to 5, where 1 corresponds to good air quality and 5 to hazardous air, regardless of the context.
The relative AQI variant is not based on absolute thresholds but on a moving average over the past 24 hours. Its scale ranges from 0 to 500, where a value of 100 means that the current air quality is identical to the average over the past 24 hours. Below 100, air quality is better than this average, and above it, it deteriorates. This version is therefore more dynamic and allows for much finer tracking of air quality variations, reacting very quickly to changes in the environment, which makes it particularly useful for observing the impact of everyday activities such as cooking, using a spray, or simply ventilating a room.
Experiment with the new AQI
To compare the behavior of these two new indices, we conducted a simple experiment. In a semi-basement studio (see floor plan below), the Yocto-VOC-V4-C was attached to an aluminum plate with a magnet, with a fan blowing air toward it 24 hours a day.
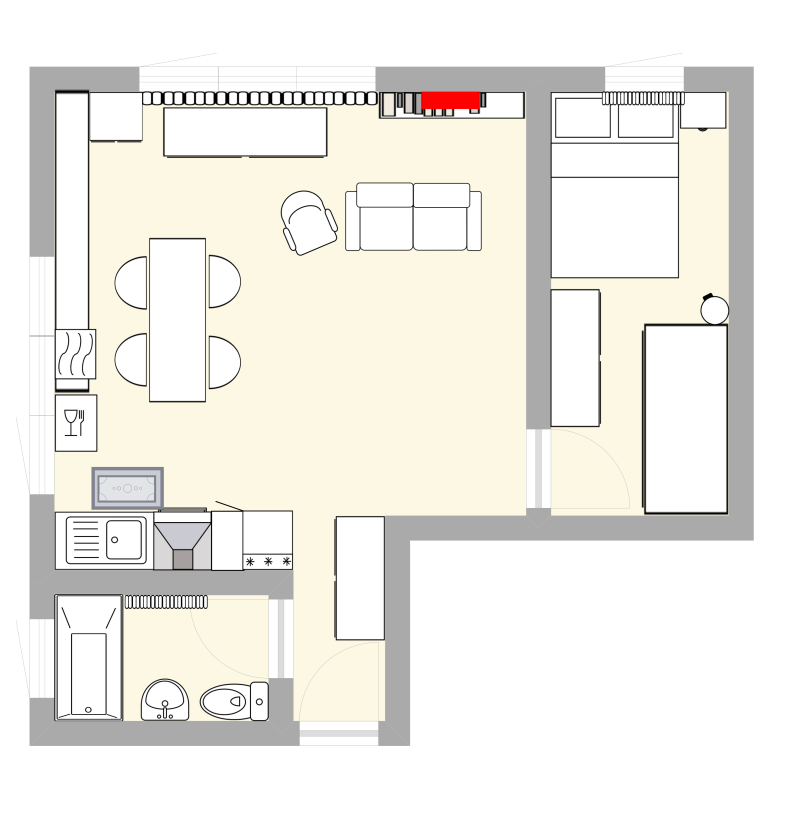
Studio floor plan, voc sensor shown in red
Day 1
On the first day, we set the AQI to relative mode:
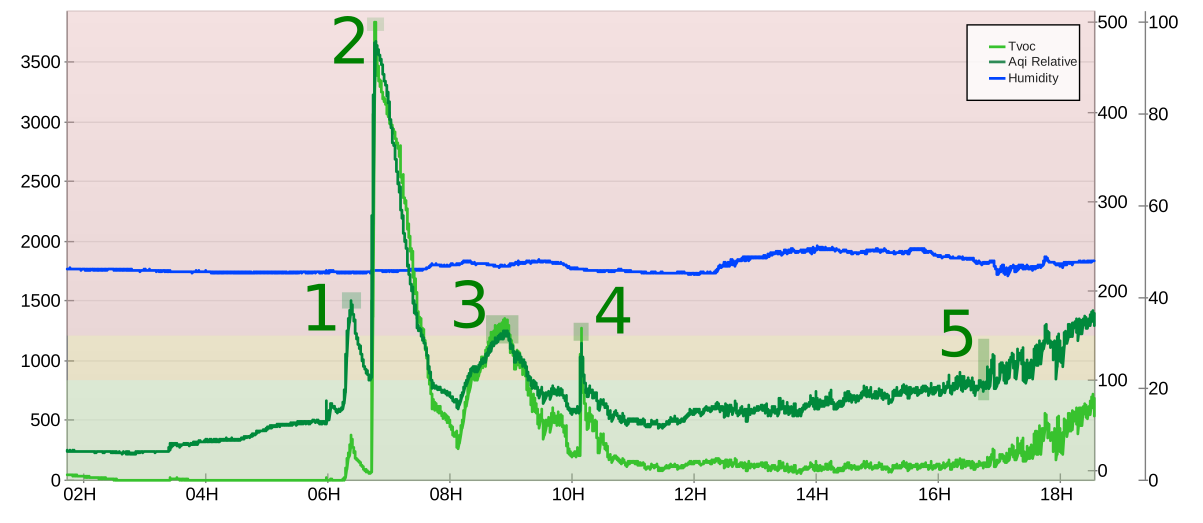
Day 1, AQI in relative mode. 16h of recording
- Point 1: ≈ 6:20 a.m., wake-up.
- Point 2: ≈ 6:50 a.m., breakfast, pan-fried.
- Point 3: ≈ 9:00 a.m., cleaning the table.
- Point 4: ≈ 10:00 a.m., leaving for the office.
- Point 5: ≈ 4:40 p.m., starting the dishwasher.
At the end of the first day, the Yocto-VOC-V4-C showed us spikes in AQI and tVOC levels at times when VOCs are likely to be generated. The peaks appear to be somewhat high, which still indicates a sudden deterioration in indoor air quality.
Day 2
Next, we switched to UBA AQI mode for two days:
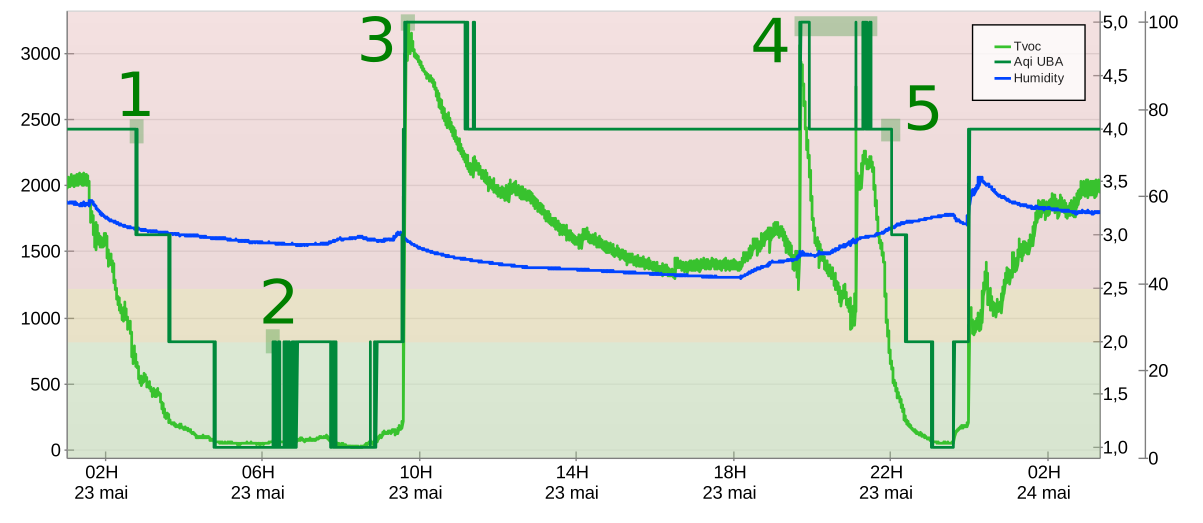
Day 2, AQI in UBA mode. 24h or recording
- Point 1: ≈ 3:00 a.m., morning drop in the AQI.
- Point 2: ≈ 6:20 a.m., wake-up.
- Point 3: ≈ 9:30 a.m., breakfast, pan-fried.
- Point 4: ≈ 7:00 p.m., starting the dishwasher.
- Point 5: ≈ 10:00 p.m., bedtime.
We have a very different result for this second day. Since almost the entire day was spent in the living room, this generated a significant amount of VOCs. Although the ventilation was on and the windows were open, the air quality never managed to return to an acceptable level. Although the UBA AQI indicated a level 5 (very poor air quality according to its thresholds), we survived, which clearly illustrates the limitation of the UBA AQI: its absolute thresholds can seem alarmist in some contexts.
Day 3
Second day in UBA AQI mode:
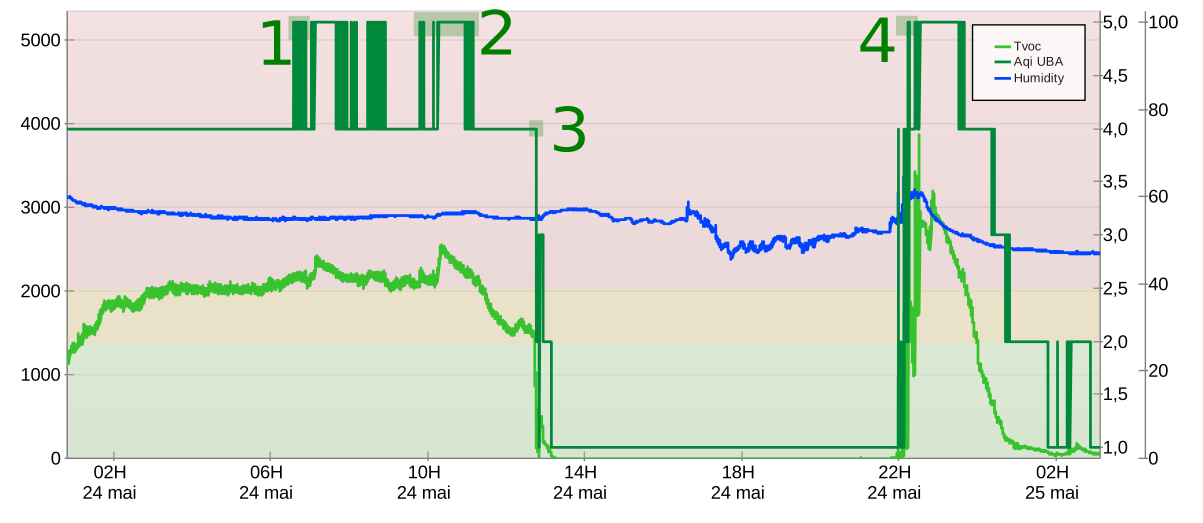
Day 3, AQI in UBA mode. 24h of recording
- Point 1: ≈ 7:00 a.m., wake-up.
- Point 2: ≈ 10:00 a.m., breakfast, pan-fried.
- Point 2 (bis): ≈ 12:00 p.m., lunch, cooked in the oven and in a pot.
- Point 3: ≈ 1:00 p.m., departure, day out.
- Point 4: ≈ 10:00 p.m., returning home.
- Point 4 (bis): ≈ 10:20 p.m., starting the dishwasher and showering.
For this day, spent mostly outdoors, the most interesting moment occurs around 10:00 p.m.: the return home, the dishwasher, and the shower caused a noticeable increase in the AQI, TVOCs, and humidity. The difference between the UBA AQI and the relative AQI is starting to become apparent, but before drawing any conclusions, let's add one final day of measures.
Day 4
Last day, in relative AQI mode:
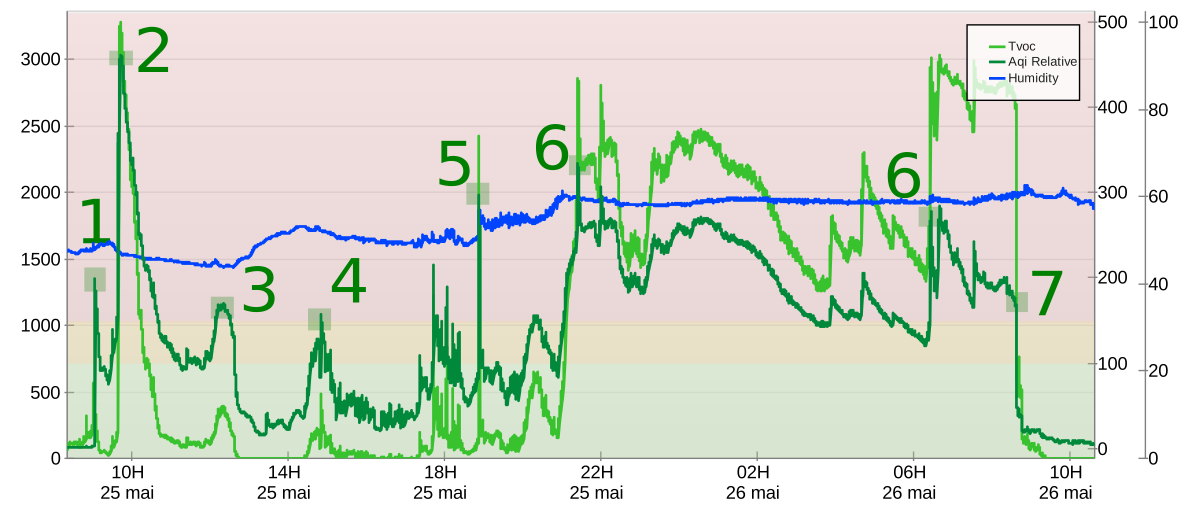
Day 4, AQI in relatve mode. 24h of recording
- Point 1: ≈ 9:00 a.m., wake-up.
- Point 2: ≈ 10:00 a.m., breakfast, pan-fried.
- Point 3: ≈ 12:30 p.m., lunch, cooked in a pot and a pan.
- Point 4: ≈ 3:00 p.m., vacuuming.
- Point 5: ≈ 7:00 p.m., dinner, cooked in the oven.
- Point 6: ≈ 9:00 p.m., showering and bedtime.
- Point 7: ≈ 5:00 a.m., wake-up.
- Point 8: ≈ 8:30 a.m., leaving for the office.
Quite different from other days, these 24 hours include two mornings, very interesting moments because the Yocto-VOC-V4-C manages to detect when one wakes up, even though the bedroom door remained open all night.
Comparison
The two variants of the Yocto-VOC-V4-C's AQI seem to have their advantages and disadvantages. It's also important to remember that all these values are estimates, they shouldn't be considered absolute measures, but rather as indicators of trends.
For the relative AQI:
- It tends to "get used" to polluted air, since it calculates a moving average over the last 24 hours. This is why you should also pay attention to values below 100 to ensure that air quality is actually improving.
- By adapting to ambient air conditions over the past 24 hours, it is more effective than the UBA AQI at detecting anomalies in moderately polluted air, which can be particularly useful in cities or confined spaces.
And the UBA AQI:
- It tends to react very strictly: it may display a level 5 (hazardous air) even though the situation is probably not that critical, though it does indeed indicate poor air quality.
- Based on absolute tVOC thresholds, it should provide a more rigorous assessment that is independent of historical data.
The relative AQI is therefore better suited to detecting rapid changes in various environments, thanks to its adaptability. The UBA AQI is preferred when assessing air quality against criteria defined in a standard, although the accuracy of the estimate remains questionable.
Finally, since the Yocto-VOC-V4-C costs us less to manufacture than version 3, it is sold at a lower price. Sure Thing.