 At Yoctopuce, we like to travel by electric bike and we have decided to measure the charge of an electric bike battery with a Yocto-Watt and the Yocto-Visualization application. This doesn't require any programming, but a rather good knowledge of Yocto-Visualization to obtain a readable and pretty graph. We thought that monitoring the electrical consumption of a device could interest other people. Here is what we did.
The first thing to do is to connect the Yocto-Watt between the mains socket and the consumer, in the present case the battery charger. The Yocto-Watt is electrically isolated, so you can connect directly the 200V (or 110V) of the mains socket on the Yocto-Watt without risking leaks through the USB socket. However, be careful when manipulating the device to connect it: if the Yocto-Watt is isolated, it's not the case of the human.
For our small experiment, we simply used the Yocto-Watt enclosure, but it you can make more compact and better finished installations.
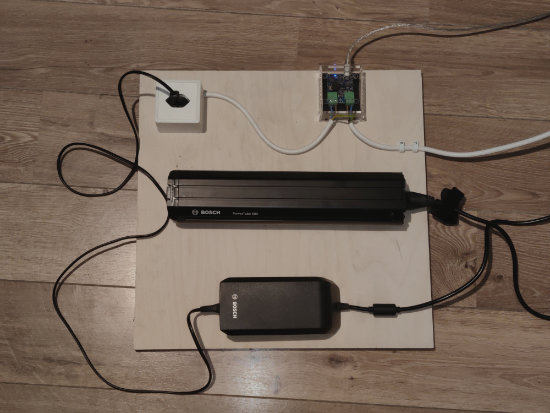
The installation of our experiment
Configuring Yocto-Visualization
When everything is assembled, you need to connect the Yocto-Watt to a USB port of your computer and to run Yocto-Visualization.
To create your graph, click on "Create a new graph" on the welcome page. If a graph is already configured, use the contextual menu and select "Add a new graph".
You can access the graph configuration parameters through the contextual menu.
You must start by configuring the data that you want to display. In our case, we want to display on the graph the power consumption as well as the voltage and the current. We are going to need three data series.
The first series is instantaneous consumption.
You must select the power function of the Yocto-Watt which is connected on the USB port. If you have assigned logical names to the Yocto-Watt module, the latter are displayed in the list of available sensors. But by default, sensors are listed by module serial number and function name. In our case, that is a Yocto-Watt with the "YWATTMK1-F641F" serial number.
Then, you must select the sampling frequency. Charging a bike battery can take several hours, so we selected 12 measures per minute.
An important option to enable is "Sensor recording". When activated, the Yocto-Watt automatically saves in its internal memory the measures at the configured frequency. This prevents you from losing measures if Yocto-Visualization stops.
Finally, we take this opportunity to define the legend of the data series, that is "Consumption"
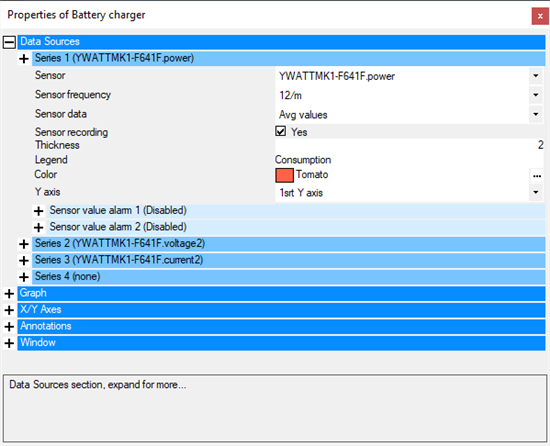
Series 1 parameters corresponding to the power measure
The second data series is the voltage. If you have never used the Yocto-Watt before, you may be confused by the presence of two voltage functions. The Yocto-Watt can measure both direct and alternative voltages, so there are two available functions. The voltage1 function is the measure of direct voltage, while voltage2 is the measure of alternative voltage. So, for our graph we need the voltage2 function as we are measuring an alternative voltage.
We use the same parameters as for the consumption measure, 12 measures per minute and "Sensor recording" enabled, but we also change the "Y axis" parameter to use a second Y Axis.
The last series is the current measure. As for the voltage measure, we must use current2 because we measure an alternative current. The other parameters are identical.
The data logger
Now that we have configured the data source, we must still configure the parameters which are global to the graph. The first is to enable data loading from the the data logger of the Yoctopuce module. Previously, we have enable recording the measures in the internal memory of the Yocto-Watt. The "use datalogger data" option enables loading existing data from the memory of the Yocto-Watt. Concretely, when this option is enabled, Yocto-Visualization loads all the data present in the data logger and adds them to the data that it receives live. Using the "Sensor recording" and "Use datalogger data" enables you to close Yocto-Visualization during the measures without losing data.
Note, when this option is activated, Yocto-Visualization loads and uses all the data present on the Yocto-Watt, including data from a prior experiment. To avoid polluting the graph with non pertinent data, it is important to empty the module data logger each time you start to charge a battery. To do so, simply right-click on the graph and select "Clear dataloggers".
Improvements
We now have a functional graph, but not necessarily a very readable one. To improve this, we first add a legend at the bottom right of the graph. We also enable the "Data tracker" option which displays the exact value of the different dots of the graph when you move the mouse cursor in their vicinity. We then add legends for each axis, that is "Time","Watt", "Voltage", and "Milliampere". Finally, we change the name of the window so that it better describes the graph.
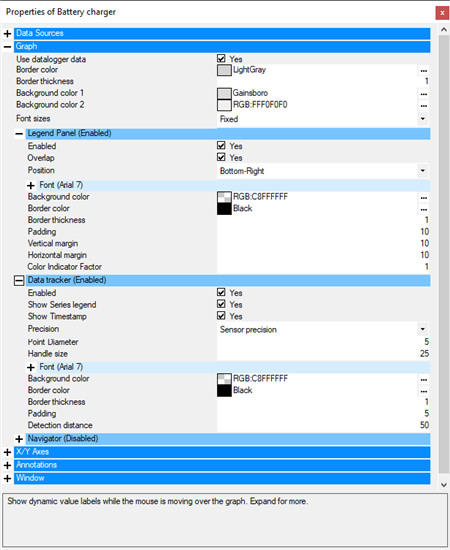
The global parameters of the graph
In the end, we have the following graph:
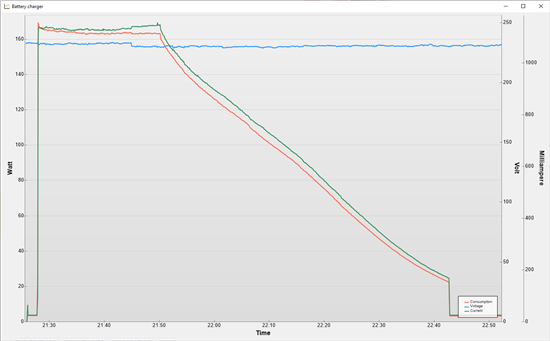
The final graph
Conclusion
This example illustrates the different features of Yocto-Visualization. This tool is free and available for Windows, macOS, and Linux on our web site. If you want to modify it or to port it to a specific architecture, you can do so as the source code is available on GitHub.
As for our graph, it made us realize that the battery charger was constantly consuming 3.5W, even when no battery was connected. If you have an electric bike at home, remember to disconnect the charger when not in use, this will prevent you from consuming electricity for nothing.


