 There are more and more services enabling you to store your measures in the cloud. We already presented free (but limited) solutions such as EmonCMS and ThinkSpeak, and more recently the commercial solution Microsoft Azure. Today, we present the professional solution developed by our US reseller, Valarm.net, which is today the only one to exploit the advanced features of Yoctopuce modules and also offers features linked to geolocation that you don't find in other services.
Step by step configuration
The Valarm cloud service was first designed as a centralized storing solution for alarms and measures send by sources in distinct locations. To configure this system, you must naturally start by defining "measuring sources", simply called Devices. A source can be composed of several Yoctopuce sensors, as long as they are at the same location. For example, a source can be a YoctoHub-Wireless-g with several Yoctopuce sensors, an Android smart phone using the Valarm app (with or without Yoctopuce sensors), or even a Raspberry Pi equipped with some sensors and using our VirtualHub. Android support is an interesting addition to other solutions based on the YoctoHubs, because it adds the possibility to work by GSM.
To connect a measuring source, create an account on tools.valarm.net and click on the Device Manager tab. You must then buy some credits, even to perform your tests. This is fortunately not a deterrent: for the price of two beers, you have 30 days to test your data source and decide whether you like the solution.
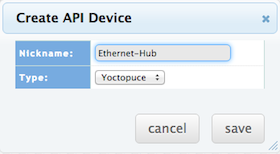
When you have bought some credit, click on the Create an API Device button. Provide an arbitrary name for your source, and select either the Yoctopuce type if it's a YoctoHub or a VirtualHub, or the Valarm type if you want to use the Valarm Android app (even if it's with Yoctopuce sensors):
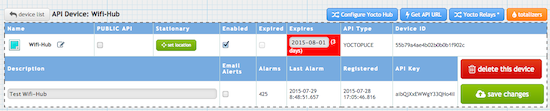
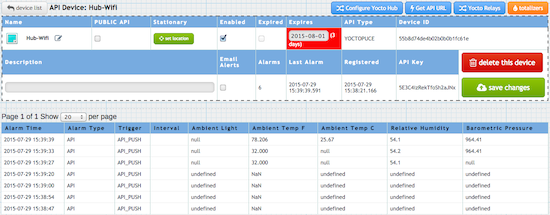
Then click on Save. You obtain the summarized view of your Device:
You are now ready to try to send data from your YoctoHub. Click on the Get API URL button to obtain a Routing code enabling the hub to send data on this Device. This code is not only a unique identifier, but it is also embeds a signature, which does not transit on the network but attests that the data source is authorized.
Then, connect to your YoctoHub. In the module list, click on the configure button on the right hand side of the line corresponding to the VirtualHub itself, to configure the HTTP callback. In the configuration window, make sure you have an up-to-date firmware, then find the Outgoing callbacks section and click on the edit button to configure your callback to the Valarm cloud.
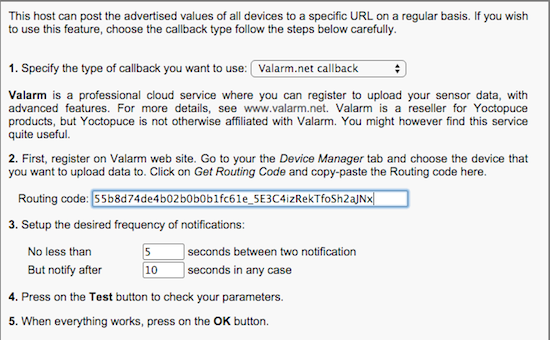
Copy-paste the Routing code that you have retrieved from the Valarm interface, and that's it. You can click Test to perform your first connection test, and then save.
Back in the Valarm interface, you can now finish to configure your measuring source. Click on the Configure Yocto Hub button to obtain the following window:
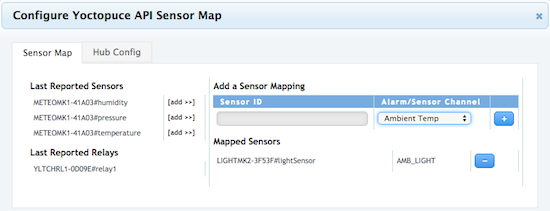
On the left, you find the list of the sensors detected on your YoctoHub. For each measure you are interested in, click on the add >> button and selected the predefined channel to which you want the measure to correspond. For example, for an ambient temperature measure, you can use the Ambient Temp channel while for punctual temperature measures by thermocouple you can use the Temp01...Temp08 channels. After each correspondence definition, click + and the correspondence is saved. When you are done, close the configuration window and click on save changes.
Visualization
By clicking on the Device name, you can see a table with the list of measures that the measuring source has already sent:
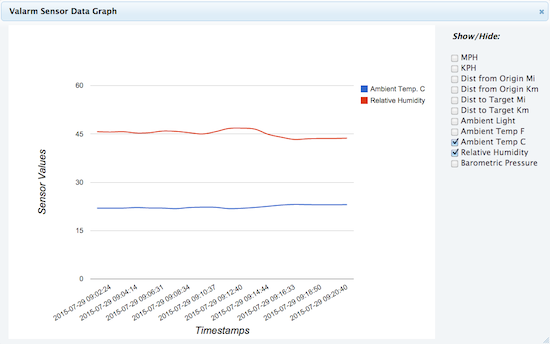
The Graph All Sensors button enables you to instantaneously obtain an overview of the latest installed measures. It's more a verification tool than a true visualization solution as you can't configure the time range, but it's quite useful:
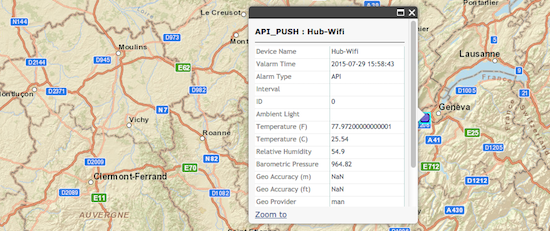
To keep in the spirit of the tool, you can geolocate your data source. If it's a fixed data source, simply click on the set location button and indicate where it is. It's enough to later obtain on the Command Center tab a geographic view (interactive map) of all your actives sources, where a simple click enables you to view the latest received measures:
But there is even better: you only need to connect a Yocto-GPS on your YoctoHub, or to use the Android app on a phone with a GPS, for the measures to be geolocated dynamically at all times, without configuring anything else. The geographic view then takes its full meaning.
The Esri ArcGIS Tools tab enables you to even automatically segment the measured values, with an intuitive visual overview enabling an estimate by eye of value variations and data availability depending on geographic locations.
However, if you need other visualization tools, in particular to obtain graphs with personalized scales, you need to develop your own interface. Valarm provides an API to retrieve your data and some JavaScript examples, including on how to plot graphs with the NVD3 library. If programming is not your cup of tea, all is not lost: Valarm is currently working on a completely user configurable interface, which we are impatiently waiting for...
Other specificities
Among the specificities of the Valarm solution, it enables you to directly modify from the management console some configuration parameters of the YoctoHub itself. For instance, in the Hub Config tab of the Device configuration, you can change the callback frequency:
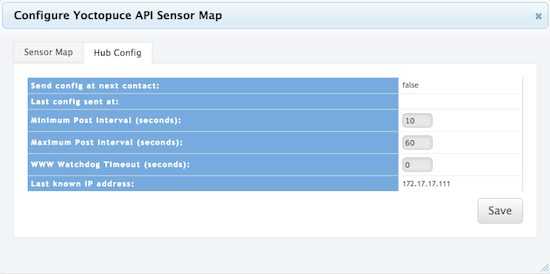
You could change this setting directly by connecting to the YoctoHub too, but if you don't have a direct access, it's very useful to be able to configure it remotely this way. Next time the hub connects itself to the Valarm server, the callback frequency is automatically updated. It's one of the advantages of the Valarm solution, which was coded in particular for Yoctopuce modules, which is not the case of other, generic, cloud solutions.
Moreover, Valarm can automatically remotely switch Yoctopuce relays. As of now, the option is quite limited, as it is a periodic switch at a predefined interval, but it already enables a remote intervention on the hardware (to restart an appliance, for instance). But we guess this function will probably be enhanced in the future. We already foresee, for example, possibilities linked to conditional triggers depending on predefined alarm thresholds.
Valarm also offers the possibility to perform some simple operations on the measured values, such as linear transformations, or an integration of pulse counts (to manage counters, for examples). You can find diverse very concrete application examples using these possibilities on the Valarm blog.
Conclusion
Valarm is certainly the cloud solution which exploits the most completely the possibilities of Yoctopuce modules to send data by HTTP callback. It's also the only one to this day which uses the signed Yocto-API transport method, enabling the detection undue data sending. It's also the only one to offer a solution which can also use an Android phone to send data.
Sure, Valarm is not a free solution, but there is no free lunch: maintaining and improving a service such as Valarm.net has a cost. And in the opposite to Xively for example, which became way too expensive for ordinary people, Valarm costs for a punctual solution are perfectly reasonable. Compared to the generic solution based on Microsoft Azure which we presented recently and which has similar use costs, Valarm offers a much more evolved solution for tracking measurements.
The upcoming new configurable graphic interface will make the Valarm solution even more interesting for small businesses which don't have the means to develop their own interface. In the mean time, for somewhat more ambitious projects, your can also contact Valarm directly: as you can see in their blog, Valarm can also provide services for the implementation of specific projects.

