![]() Last week, we built a solar weather station which posts its data on xyvely. It's convenient, but it would be simpler to be able to consult the data without having to turn on a computer. This week, we tell you how to show this data on a Yoctopuce display. This requires some programming, but nothing too complex. If you wish, we can do this together...
Last week, we built a solar weather station which posts its data on xyvely. It's convenient, but it would be simpler to be able to consult the data without having to turn on a computer. This week, we tell you how to show this data on a Yoctopuce display. This requires some programming, but nothing too complex. If you wish, we can do this together...
Architecture
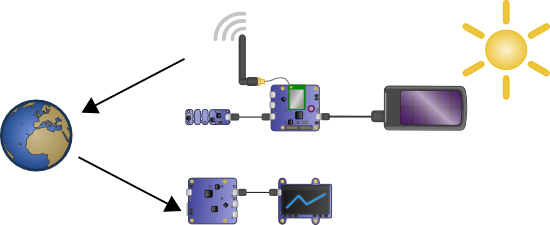
We use the same architecture that we previously used for the stand alone RSS reader. So we use a Yoctopuce display which we connect to a YoctoHub-Ethernet. The YoctoHub-Ethernet and the YoctoHub-Wireless are configured to connect themselves to a PHP server which runs a script managing the data transfer.

The complete schema of the weather station + display installation
Programming
We here take advantage of the possibility of Yoctopuce hubs to connect themselves to a server to run a PHP script. This technique, called HTTP callback, enables us to go through the NAT filters of ADSL routers without trouble. From the programming stand point, everything is transparent: the code is identical to code driving modules connected locally.
We want to display data of the Yocto-Meteo of the weather station, but as we use a graphical display, we can take this opportunity to trace a graph. This raises the question of data history. We could use the Yocto-Meteo data logger, but to reach it through an HTTP callback connection will be very slow. So we are going to proceed in a classical manner with a mySQL database. Therefore, you need a PHP server and a mySQL database. It's usually the bare minimum offered by web site hosts. You can also use a PHP/mysql framework such as easy PHP or Mamp on one of your machines.
The database
We simply create a table enabling us to store the history of the weather station data and we call it weather. This table has the following structure:
| Columns | Type | Use |
|---|---|---|
| time stamp | integer | date/hour of the measure |
| temperature | double | temperature values |
| humidity | double | humidity values |
| pressure | double | pressure values |
| feed | integer | managing several parallel feeds |
We simply added a little trick: a feed number enabling us to use several instances of the installation in parallel.
Initializing
To initialize the script, we must include the needed Yoctopuce libraries, create the connection to the database, and initialize the Yoctopuce API.
include("yocto_api.php");
include("yocto_temperature.php");
include("yocto_humidity.php");
include("yocto_pressure.php");
include("yocto_display.php");
include("yocto_wakeupmonitor.php");
include("yocto_network.php");
// database connection, replace with your own credentials
$conn = mysql_connect(DB_SERVER,DB_USER,DB_PASSWORD);
$res = mysql_select_db(DB_NAME);
// API init, note the "callback" parameter for HTTP callback mode
if (yRegisterHub("callback",$errmsg)!=YAPI_SUCCESS) die($errmsg);
To keep things compact, we decided to use the same script to send the data from the weather station and to retrieve them for the display. Tasks to perform are based on the presence or not of the temperature sensor and the display.
Sending the data
We detect which device, between the display or the weather station, called the script based on the presence of the yTemperature function. We then only need to retrieve the values of the distinct sensors and to store them in the database.
$humSenor=YFindHumidity("METEO.humidity");
$pressSensor=YFindPressure("METEO.pressure");
$monitor=YFirstWakeUpMonitor();
if ($tempSensor->isOnline())
{
$temp = $tempSensor->get_currentValue();
$hum = $humSenor->get_currentValue();
$pre = $pressSensor->get_currentValue();
$timestamp = time();
mysql_query("insert into weather "
."(timestamp,temperature,humidity,pressure,feed) "
."values ($timestamp,$temp,$hum,$pre,$feed)");
...
When the values are stored in the database, we can ask the YoctoHub-Wireless of the weather station to go back to sleep until the next measure to save energy. This avoids to have to wait until it automatically turns off by itself.
Display on the screen
The display part is based on the presence or absence of a display screen. For a clean display, we use a double buffering technique: we display a layer, and we draw in another, invisible one. When the drawing is complete, we permute the content of the layers. Here we work with layers 3 and 4.
{
// fetch data from database, group by 15 min clusters
$result = mysql_query("select * from weather where feed=$feed and timestamp>".($timestamp-60*15*128)." order by timestamp");
if (!$result ) die(mysql_error());
//..
//code to group data by 15 minutes clusters
//and compute max/min values
//..
$width= $display->get_displayWidth();
$height= $display->get_displayHeight();
// we use double buffering
$layer4 = $display->get_displayLayer(4);
$layer4->reset();
$layer4->hide();
..
We display the pressure and temperature values. Please note: the pressure sensor of the Yocto-Meteo provides an absolute pressure, while we are more interested by the barometric pressure which is normalized with regards to the standard pressure at sea level. So we must apply a correction which depends on the altitude of the weather station and on the surrounding temperature.
// altitude correction
$Z = 500; // weather station altitude, in meters
if (isset($_GET['alt'])) $Z = intval($_GET['alt']);
// display humidity and pressure in the corners
$tempK = $lastTemp + 273.15; // temperature in deg K
$barometricPress=round($lastPress*pow(($tempK+0.0065*$Z)/$tempK,5.2561));
// display humitity and pressure in the corners
$layer4->selectFont('Small.yfm');
$layer4->drawText(0,0,Y_ALIGN_TOP_LEFT,'P:'.$barometricPress);
$layer4->drawText(0,$height-1,Y_ALIGN_BOTTOM_LEFT,$lastHum.'%');
..
We trace the temperature graph using some simple lineTo
$i=0;
if ($history[$i]["count"]>0)
$layer4->moveTo( $width-15 ,
round(($height/2)-($history[$i]["temp"]-$middle)*2));
for ($i=1;$i<sizeof($history);$i++)
if ($history[$i]["count"]>0)
$layer4->lineTo($width -$i-15,
round($height/2-($history[$i]["temp"]-$middle)*2));
Finally, we display the temperature in boldface, in the middle of the screen. As temperature will most likely overlap the graph, we create a black border around the numbers by first drawing the temperature in black but slightly shifted, and then finally the temperature in "white" in the middle.
$layer4->selectColorPen(0);
$layer4->drawText($width/2-1,$height/2,Y_ALIGN_CENTER, $lastTemp);
$layer4->drawText($width/2+1,$height/2,Y_ALIGN_CENTER, $lastTemp);
$layer4->drawText($width/2,$height/2+1,Y_ALIGN_CENTER, $lastTemp);
$layer4->drawText($width/2,$height/2-1,Y_ALIGN_CENTER, $lastTemp);
$layer4->selectColorPen(0xffff);
$layer4->drawText($width/2,$height/2,Y_ALIGN_CENTER, $lastTemp);
...
In the end, we swap the layers, so that the display update seems instantaneous.
Here we are, it's done. In truth, the code is slightly longer: we willingly skipped some parts which weren't all that interesting for this article. But you can download the complete code here.
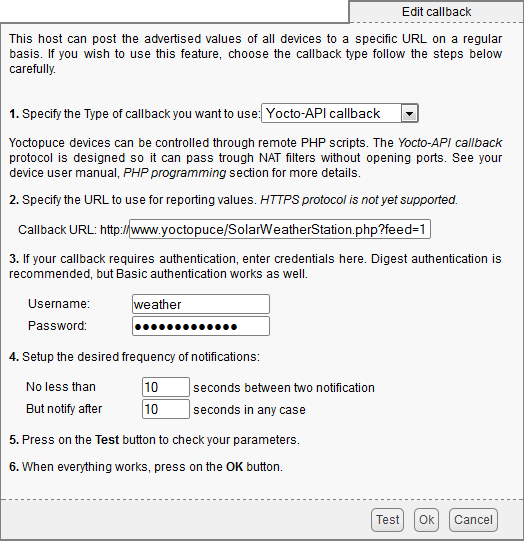
The last thing to do is to configure the weather station hub and the display hub so that they call this script at regular intervals.

Both hubs are configured to call our script
The result
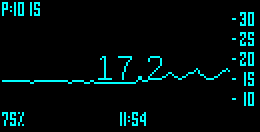
We can now let the weather station and the display fend for themselves, and after a while, we see the graph being built.

A screen shot
Here is the result over a day in time lapse, with a frame per minute.
You'll note that nothing prevents you to put the weather station at one end of the world and the display at another, as long as you have network connectivity. You can also do the opposite: connect a Yocto-Meteo and a display on the same YoctoHub-Ethernet.


