![]() The Yoctopuce business model is rather simple: Yoctopuce designs, manufactures, and sells electronic modules, provides the libraries necessary to exploit them, as well as support to help customers realize their projects. However, Yoctopuce doesn't provide turn key solutions. Nevertheless, Yoctopuce support regularly receives requests of the type: "How can I display a graph with the values of a Yoctopuce sensor?", or "How can I obtain the values of a Yoctopuce sensor in the CSV format?". So we decided, once will not hurt, to offer you a ready to use application to trace graphs with the values of Yoctopuce sensors.
The Yoctopuce business model is rather simple: Yoctopuce designs, manufactures, and sells electronic modules, provides the libraries necessary to exploit them, as well as support to help customers realize their projects. However, Yoctopuce doesn't provide turn key solutions. Nevertheless, Yoctopuce support regularly receives requests of the type: "How can I display a graph with the values of a Yoctopuce sensor?", or "How can I obtain the values of a Yoctopuce sensor in the CSV format?". So we decided, once will not hurt, to offer you a ready to use application to trace graphs with the values of Yoctopuce sensors.
Principle
The proposed application is based on HTTP callbacks, which are available to the VirtualHub and to all the YoctoHubs. It is actually a PHP script that you must put on a PHP server. At a regular interval, each hub contacts the server to communicate the value of each sensor and the server stores them. Then you only need to connect yourself on the server with a simple web browser to obtain a nice representation of the data. You can configure the interface rendering with a few clicks: style, color, size, position of the graphs, and so on.

Principle of the application
The advantage of this architecture is that it allows you, among other things, to use a public server while keeping the sensors safely behind a NAT filter.
Ingredients
To trace nice graphs from your Yoctopuce sensors, you need:
- Yoctopuce sensors, note that the application can also display the input state of YAnButton and YRelay.
- A YoctoHub, you can choose among:
- A YoctoHub-Ethernet
- A YoctoHub-Wireless
- A YoctoHub-GSM
- Or even a computer, with a network connection, running a VirtualHub
- A PHP server, you can either
- Use a pre-existing web hosting service to which you have access
- Use a free host, at your own risk.
- Install a web server such as MAMP or EasyPHP on one of your local machines
- A web browser, never mind the platform or the operating system
Note that you don't need a database: to be as easy to install as possible, the application uses a file system to store the sensors data.
Installation
The application is designed to be as easy to install as possible. You only need a few PHP files that you can find here or on GitHub. There are 7 files: index.php, yocto_api.php, yocto_anbutton.php, yocto_network.php, yocto_relay.php, yocto_wakeupmonitor.php and yocto_wakeupschedule.php. Only index.html is new, the other ones are simple copies of those found in the PHP library.
To install the application, you only have to:
- Copy these files on your server, preferably in a sub-directory.
- Create a data sub-directory at the same level.
- That's it.
For purposes of demonstration, let's imagine that we copy these files on the www.yoctopuce.com web server in the YoctoCloud sub-directory. The result should more or less look like the image below:

Simply copy the files on your web server and create a data sub-directory
Note that the server is going to create files in the data sub-directory, so make sure that the server has write permissions on this sub-directory.
Configuration
Hub configuration
We are going to suppose that you want to use a VirtualHub to send the data of a Yocto-Meteo on your server, but the configuration of a YoctoHub would be exactly the same. Make sure that your VirtualHub is actually running and connect yourself to it with a web browser. The address is usually http://127.0.0.1:4444. Open the configuration window and edit the Callback URL parameter in the outgoing callback section. Select a callback of the type "Yocto-API callback" and enter the URL of the index.php script. In our example it is www.yoctopuce.com/YoctoCloud/index.php.
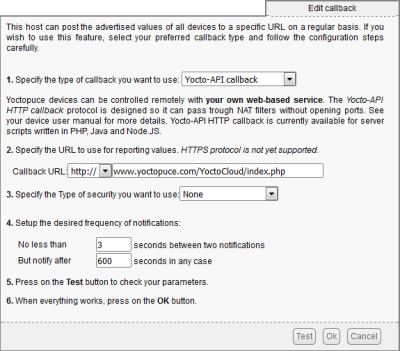
Configuration of the callback
When you have entered these parameters, simply click on the test button. You should obtain a message ending with "Done." as on the screenshot below.
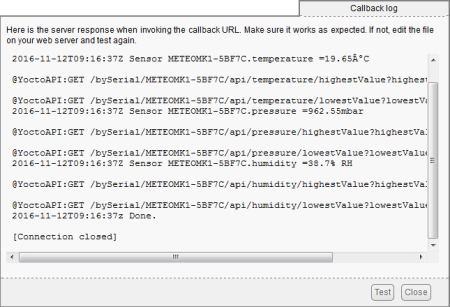
It works
If you obtain the message "url_fopen is not allowed, please fix server configuration.", create at the level of index.php a file named ".htaccess" containing the line:
php_flag "allow_url_fopen" "On"
If the .htaccess file already exists, don't erase it! simply add the line above in it. When it works, close the test window and save the configuration. That's it, the hub configuration is done. Note that you can configure as many hubs as you want on the same callback.
Application configuration
With a web browser, connect yourself on the server. In our example, the URL is www.yoctopuce.com/YoctoCloud/index.php?edit, note the ?edit at the end. Click on the "Got It" button and you obtain an empty page with a red menu on the top left. In this menu, select "new chart", and an empty graph appears in the middle of the page:
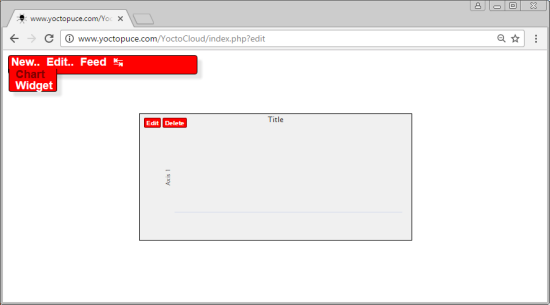
New graph
In the top left of the graph, there is an "edit" button which enables us to configure this graph: click on it to display an interface on the left of the page. This interface is composed of 4 sections:
- Window, to modify the size, the position, and the appearance of the frame surrounding the graph
- Data set, to define the lines displayed in the graph
- Vertical axis , to define one or several vertical scales to be used
- Legend, to display a legend, if need be.
All these options enable you to select almost all the aspects of your graph. Changes are applied in real time, playing with the options should enable you to understand the effect of each parameter. If you leave the mouse idle a few seconds on a parameter, a short description pops up. The minimal required action to configure your graph is to select the sensor to be displayed through the Data src parameter in the data sets section. Each "data src" corresponds to a channel of a Yoctopuce sensor.
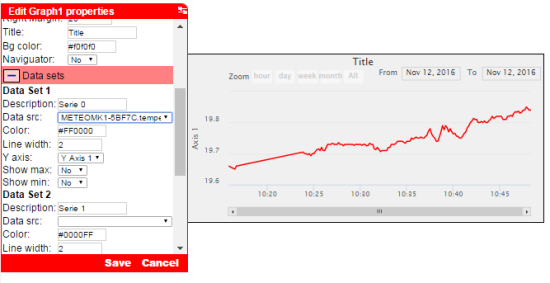
Graph configuration
You can define as many graphs as you wish, you can have up to 3 lines per graph. This limit is defined by a constant at the beginning of the source code, you can easily change it if need be.
Texts and variables
You can also define text blocks containing variables automatically taking the values of the sensors. You can define these text blocks in the main menu "New../Text block". Each text block can contain up to 6 distinct variables defined as {$1} to {$6}. You can define the different characteristics of the text blocks in the same manner as for the the graphs.
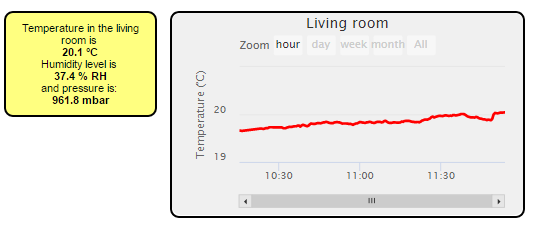
You can define text blocks
You'll soon notice that the interface panels tend to overlap parts of the screen that you are interested in. You can make them switch from one side to the other by clicking on the ↹ icon.
When you have configured your different items, reload the web page without the "&edit" parameter on the URL, which makes the configuration interface disappear.
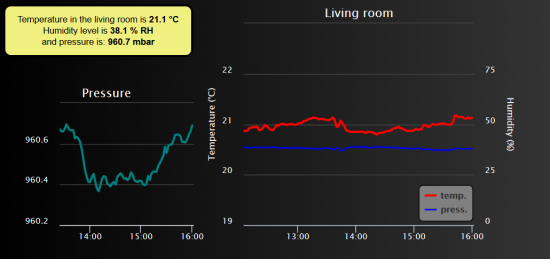
You can configure almost everything without having to write a single line of code
The feeds
The system is based on the concept of feeds. A feed is a simple identifier which allows you to define a set of sensors to be displayed on the same page. This enables you to use the same script to display distinct sets of sensors. By default, the name of the feed is "default", but you can define other ones. You only need to define it on all the URLs used by the system. For example, if we want to define a set of sensor under the "mydata" name, the distinct URLs are:
- www.yoctopuce.com/YoctoCloud/index.php?feed=mydata for the HTTP callback
- www.yoctopuce.com/YoctoCloud/index.php?feed=mydata to view the interface
- www.yoctopuce.com/YoctoCloud/index.php?feed=mydata&edit to edit the interface
Bonus
On top of displaying graphs, the application also allows you to
- Remotely define the HTTP callback frequency
- Remotely define the wake up parameters of the YoctoHub-Wireless and of the YoctoHub-GSM
- Display the raw data of the sensors and to download them in the CSV format
- Define a policy to erase the oldest data
Important remarks
We looked at all the main characteristics of this application, we only need to conclude with some remarks:
Security
This application offers no authentication method. If you install it on a public server, we recommend that you protect its installation directory with a user name and a password. Usually, hosting providers have an interface allowing you to do so in a few clicks. Beware, you must then also indicate the user name and the password in the callback configuration of the hub.
Scalability
This application was coded to be easy to install and easy to use, not to be scalable. You can easily manage about one hundred sensors. But if you have thousands of them, you should think of using a better suited commercial cloud solution, such as VALARM.
HighStock
This application is based on the excellent Highstock library, published by HighSoft, which is free only for a non commercial use. If you intend to use this application to earn money, directly or indirectly, we suggest that you carefully read the Highstock terms and conditions and that you get a license. Trust us, these people have done a fantastic job and have earned their money.


