 Electric consumption has been at the heart of the news in recent years. Being great fans of graphs and measurements, we propose a small system allowing you to follow in real time the electric consumption of a workbench. As I am new here at Yoctopuce, I was appointed guinea pig to do it my own way, while discovering Yoctopuce modules at the same time.
For this system, we use a Yocto-Watt connected serially to a an extension cord which is the only power source for the whole workbench. The idea of the system is to measure electric power thanks to the Yocto-Watt, then to treat these measures in a Python script, and to send them to a web server for display, in the present case Node-RED. All messaging is done through the MQTT protocol.
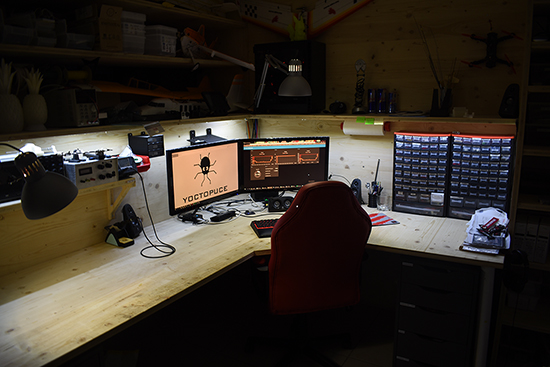
The workbench used for the power consumption measure
First tests
To begin, in order to test our Python script before we build the complete system, we build a first temporary system with a single plug, a base, and a led bulb:
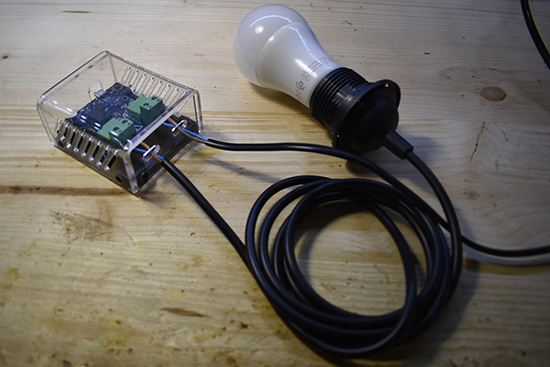
The test system
The script is ready, we start by printing holders to mount the Yocto-Watt and its enclosure under the workbench:
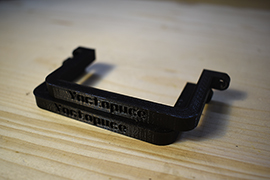
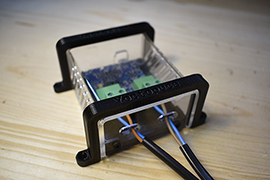
Enclosure holders and enclosure
We can now make the extension cord of which the Yocto-Watt is going to be part. We take two high voltage cables, we add a mains socket and a mains plug, and that's it.
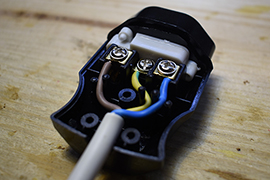
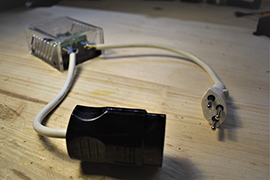
The high voltage part
Installing the system
We move a piece of furniture and a few boxes to access to the extension cord to cut it and to add to it a plug and a socket.
We then mount the Yocto-Watt and its enclosure under the workbench with four wood screws:
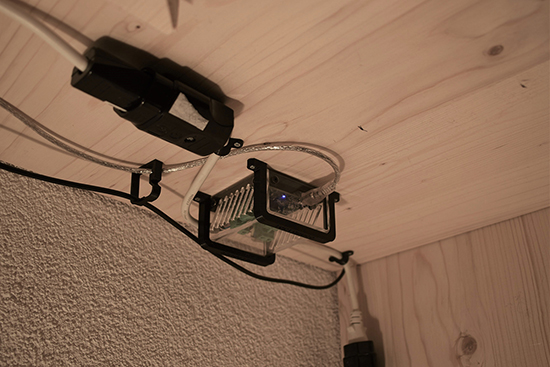
The Yocto-Watt mounted under the workbench
The high voltage cables as well as the USB cable are mounted on the workbench with holders that we printed specifically for the correct cable diameter:

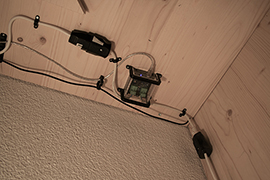
Cable holders and the whole mounted system
The software part
Now that the hardware part is done, we are going to talk software. To visualize the data, we use the Node-RED graph development tool. With the later and its graphic library, we can display power consumption data with a beautiful visual rendering. Node-RED is a web server available on all Rasbian and Noobs distributions. Parameterizing Node-RED is very simple, and there are very good tutorials available on the web. The Yocto-Watt is connected to a USB port of the Raspberry Pi 3b+ and this later reads the measures with a Python script and sends them every 5 seconds with the MQTT protocol. This is what the system tree looks like:

Working diagram of the experiment
The Raspberry publishes the data on a given topic, the Broker (messaging server) takes care to distribute the message to whomever is interested by this given topic. In our case, the Node-RED server takes care to receive messages distributed by the MQTT Broker and to display them.
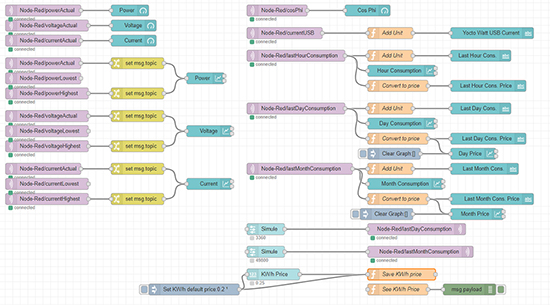
Node-RED programming flow
Here is what the programming flow looks like in Node-RED. You can see in purple the MQTT nodes, and in blue the display nodes. Purple nodes are thus nodes which receive messages from the MQTT broker. From there, the data are sent to a display node (gauge, graph, text). Finally, orange nodes are customized functions which serve to code specific functions in JavaScript.
Display
Here is the result on the web server page:

Screen shot of the web server in charge of display
The Python script computes the power consumption per hour, per day, but also per month. Now that we have all these consumption data, we can compute the cost of all this. Knowing that the number of consumed KW/h and its unit price, which is between 0.15 and 0.3 cts/KW/h in Switzerland, we can compute the price. On the following screen shot, you can see the computed costs:

Screen shot of the web server in charge of display
In the "Consumption" column, you can see the consumption per hour, per day, and per month, but also the operating cost. The operating cost per hour is almost null as the consumption is very low on this time range. The lower right graph is empty because the system has not been working for long enough to compute a whole month of consumption. You can set the KW/h price in the "Misc" column, just above the phase shift.
We only need to configure the Raspberry Pi so that it runs the script on its own. We wrote a post on this topic.
To conclude, after letting the script run for about three days, we can see form the graphs that the workbench consumption with its computer in standby and other tools costs at most CHF 0.005 per day.


