Yocto-Visualization, a free visualization app
By martinm, in Measures and New stuff, may 05,2017.
 We have a present for you today. It's something that people have been regularly asking for, despite our best efforts to be as clear as possible that Yoctopuce doesn't provide ready-to-use solutions. In the end, we decided to make a small exception:-) and to give you an application to easily visualize the values measured by Yoctopuce sensors. If you work under Windows, you will be able to display graphs, indicators, and other gadgets in a few clicks. Follow the guide...
Installation
We made installation as simple as possible. Download the installer from our web site. Unzip the file, run the YoctoVisualization.msi file, and follow the instructions. That's it.
Basic configuration
When the installation is done, you can find a shortcut in your start menu and another one on your desktop. Launch one or the other to obtain the application welcome window.
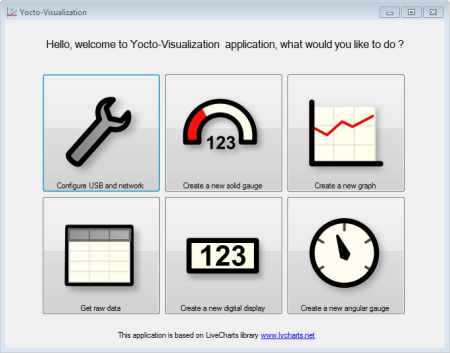
The main window
By default, Yocto-Vizualization uses only modules connected directly by USB. You can configure it so that it uses the local VirtualHub, a remote VirtualHub, or even YoctoHubs. Simply click on the large "Configure USB and network" button and make your selection.
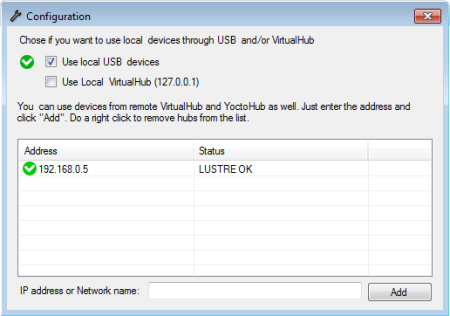
USB and network configuration
Creating widgets
The application principle is very simple. To create a widget, click for example on the "Create a new solid gauge" button. You obtain a window indicating that there is no configured source. Right-click on the said window, and select "Configure this gauge". You obtain the property editor enabling you to select, among other things, the sensor to use with your widget.
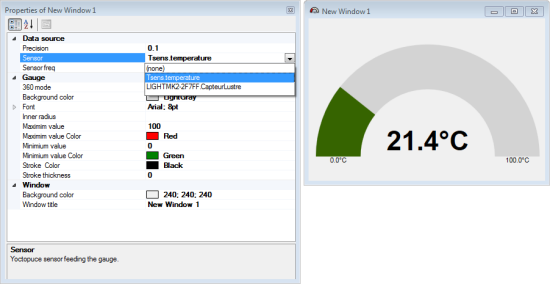
In the property editor, select the sensor to use
The property editor enables you to modify all the display parameters: color, stroke thickness, fonts, and so on. All the changes are performed in real time. At the bottom of the property editor window, you can find a short description of each parameter.
You can create four types of widgets:
- Angular gauge, a classic needle dial.
- Solid gauge, an arc dial.
- Digital display.
- Graph, a graph plotting the sensor values in real time.
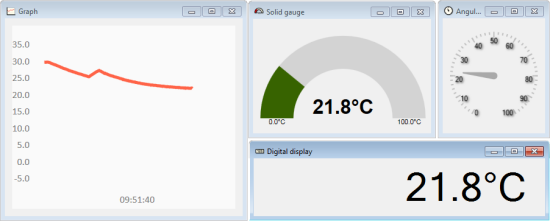
The differents types of widgets
In theory, you can create as many widgets as you wish. But if you put too many, expect some lagging :-)
Graphs
Graphs are clearly the most complex of the offered widgets, but they work like the other widgets and can display up to four sensors at a time.
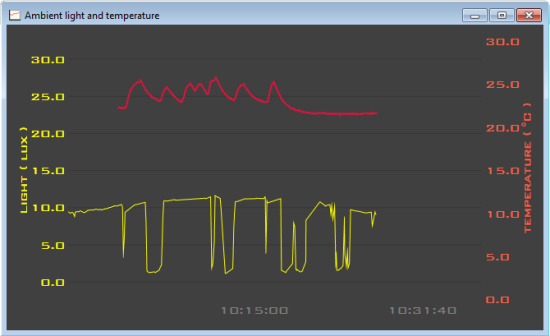
You can use several sources for the same graph
The graphs can also display the content of the sensor data loggers. They even offer a basic interface to start, stop, and erase recordings.

Graphs can display the content of data loggers
Raw data
The application can also show you the raw data of a sensor of your choice and export them in a CSV file.
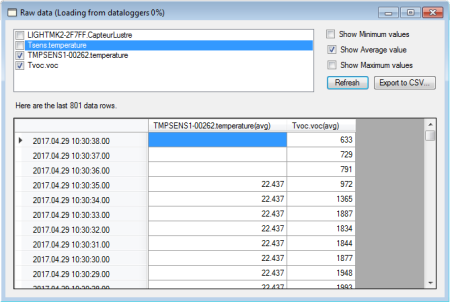
The application can display raw data
Extras...
Automatic saving
The application automatically saves the location and the content of each widget when it closes and restores them when next started. By default, this configuration is stored as an XML file in your Windows profile. But you can indicate another configuration file on the command line with the "-config" option, for example:
C:\>yoctoVisualization.exe -config "C:\tmp\testConfig.xml"
If the indicated file doesn't exist, it is automatically created. This system allows you to juggle with several configurations.
Logs
You can consult the application logs with a simple right click. But you can also ask them to be automatically displayed when the application starts by putting the "-log" option in the command line.
Finally
Naturally, the Yocto-Visualization application is offered free of charge. You can even find the C# sources on gitHub. About the sources, Yocto-Visualization is based on a third-party library. It's LiveCharts and Geared from LiveCharts. You must know that the basic version of LiveCharts is free, but Geared, the optimized version, is not. If you want to work directly with the Yocto-Visualization sources, after the LiveCharts.Geared evaluation period is over, you will probably need to buy a license to the author of LiveCharts. Expect about a hundred dollars, as everybody must live.
edit June 2018, 8th: there is now a version 2 available.
| 1 - tps | Sunday,june 04,2017 20H24 |
Are there any buggs with windows 10 ?
I cant cascade the windows on the screen.
If I like to close only one window application the hole programm stops and close.
| 2 - martinm (Yocto-Team) | Monday,june 05,2017 6H33 |
@tps: well, actually this is by design. When a window is closed, the configuration is saved and the whole application is closed.
Here at Yoctopuce we had a lengthy discussion about what should happen when one clicks on any of the close icons. We settled for this behavior as it is simplest.
What behavior were you expecting ?
| 3 - obseus | Monday,june 26,2017 15H58 |
I would expect that only the respective window closes and not the complete application.
Same behaviour as other apps too.
| 4 - martinm (Yocto-Team) | Monday,june 26,2017 16H32 |
Since the application configuration is global, each window settings cannot be saved in a separate file. So, closing a specific window would mean losing that window settings. Early versions of the application were working as you suggest, and windows were asking for a confirmation before effectively closing. This was such a nuisance, we opted for a more simple behavior.
| 5 - cjw | Tuesday,september 26,2017 17H35 |
Great that now I am finally able to visualize information from the PMW-Rx. I am simply using the Hz option to get CPS from my Bicron geiger counter. I would like to modify the solid gauge and replace the Hz with CPS. I'd also like the widget to export a simple reading without commas Reading in CPS on one column and time in another.
At this point I see no way of modifying the gauge parameters other than at a very basic level.
Also would like to take the "Hz" and make another digital gauge Hz*60= Counts per minute. (CPM)
thanks. The output so far is dead on! Very impressive. I really like the solid gauge.
I have been up to 7.5Khz =(450,000CPM). My count rate meter from RH electronics in Israel is also sharing the signal with the PMW-Rx also shows the same count rate.
| 6 - martinm (Yocto-Team) | Wednesday,september 27,2017 18H24 |
@cjw: we could improve the Yocto-PWM-RX firmware to support CPS and CPM units. Regarding the solid gauge parameters, well, the rendering is done by the LiveCharts library, so we can't make more options than the library provides.
| 7 - cjw | Sunday,october 01,2017 6H54 |
The faster you make the PMW-Rx firmware able to do CPS and CPM units the better. I am working on upgrading a very well built Bicron surveyor but the holdup is getting your device to display proper units.
I can tell you that after getting the visualization app working I was excited as the frequency (Hz was dead on)
Your device coupled with additional hardware will solve a tonne of issues with this build.
| 8 - cjw | Tuesday,october 03,2017 20H28 |
Another thing that I noticed with the Yocto-visualization is the ability to only run on a windows environment.
Is there no version that can run cross platform?
I'd be nice to have this if one was going to build off an ARM based single board computer utilizing a Linux-kernel OS.
Anyways... like I said I am impressed with yocto-visualization and how accurate it is. with those small changes Yoctopuse sensors could be able to used for more projects.
On another unrelated matter.... The laserpointer forums community is looking to a new board that could do laser measurements using the Ophir analog sensors. Your Yocto Volt would be absolutely ideal for this use. However, there would have to be a way of calibrating V:W ratio. I have such a sensor which gives a reading of 1V for every Watt of optical power. Ophir 20Y-1-Y-A (A = Analog.)
You'd sell a lot of Yoctovolt boards with the yocto-visualization program.
| 9 - martinm (Yocto-Team) | Wednesday,october 04,2017 6H53 |
@cjw: Since the Yocto-Visualization application is written in C#; It should be possible to port it to Linux thanks to the Mono framework. That's the theory, In real life, that's a lot of work, and Yoctopuce is very unlikely to invest so much time is an free application. That being said, anyone willing to give it a try is welcome: both Yocto-Visualization and LiveCharts sources files are available on GitHub.
However, Linux users are not left of the roadside, they can use the Yocto-Cloud application which is very similar, see:
www.yoctopuce.com/EN/article/a-yoctopuce-web-based-app-to-draw-sensors-graphs
Regarding laser power sensors with analog output, just have a look at the Yocto-0-10V-rx and the Yocto-MilliVolt-rx, they both provide generic sensor features which allow to map the output and customize units.
Support of CPM and CPS units in the Yocto-PWM-rx is in our to-do list, please be patient.
| 10 - mvuilleu (Yocto-Team) | Saturday,october 14,2017 12H15 |
Support for CPS/CPM has now been officially published. See https://www.yoctopuce.com/EN/article/yocto-pwm-rx-improvements
| 11 - juelue | Wednesday,january 10,2018 10H04 |
Under which windows versions will the tool work?
95, XP, Win 7, Win 10?
Thanks for your answer.
JueLue
| 12 - mvuilleu (Yocto-Team) | Wednesday,january 10,2018 10H09 |
@juelue: it works for sure on Windows 7 and later (Intel/AMD only, not Windows IoT). It may work for XP, we have never tested. It will for sure not work on Windows 95 and 2000
| 13 - tps | Thursday,february 22,2018 13H26 |
Hello...I'm missing a possibillity to set an Alarmpoint...is it possible to integrate some alarmpoints ?
that I can use the board with relays?
| 14 - martinm (Yocto-Team) | Thursday,february 22,2018 14H37 |
@tps: Well this is just a visualization app after all :-) Would an alarm setting, able to run a System Command Line when triggered, fulfill your needs?
| 15 - tps | Thursday,february 22,2018 17H37 |
I think so....
| 16 - martinm (Yocto-Team) | Friday,march 16,2018 13H47 |
@tps: done!
www.yoctopuce.com/EN/article/new-alarms-in-yocto-visualisation-app
| 17 - dabtcher | Monday,june 25,2018 4H55 |
Win-7 32 bit support
I have tried the Yocto Vizualization software under three different Win 7 platform and the only difference seemed to be was 2 of them were 64 bit versions and only one was 32 bit. I haven't been able to get it to do anything after I click on the ion on the 32 bit version. Can you tell me if there is something different i need to do with the 32 bit version of Windows for this to work?
| 18 - seb (Yocto-Team) | Monday,june 25,2018 12H33 |
@dabtcher: I've checked on a Windows 10 32bit and the Yocto-Visualization is working as expected. It should work the same on a Windows 7 32bit.
Could you contact support@yoctopuce.com and send us the screenshot of the error message and which service pack and .net framwork are installed on your system?
| 19 - obseus | Monday,july 30,2018 14H12 |
Works fine and stable under Win10x64.
Yoctopuce is the best!
| 20 - crofter | Monday,august 06,2018 14H25 |
Hi how do you add another data set to a graph can't find it anywhere i have 4 at the moment need at lease 5. Thanks
| 21 - martinm (Yocto-Team) | Monday,august 06,2018 14H40 |
@gavin: this is not available in the UI, but it can be done quite easily if you are willing work with the source code:
1- Download the project from GitHub, open it with VisualStudio
2- Edit the file properties.cs
3- Search for Graph_Serie3 property
4- Define a Graph_Serie4 property in a similar way
5- Recompile, that's it.
![]() We have a present for you today. It's something that people have been regularly asking for, despite our best efforts to be as clear as possible that Yoctopuce doesn't provide ready-to-use solutions. In the end, we decided to make a small exception:-) and to give you an application to easily visualize the values measured by Yoctopuce sensors. If you work under Windows, you will be able to display graphs, indicators, and other gadgets in a few clicks. Follow the guide...
We have a present for you today. It's something that people have been regularly asking for, despite our best efforts to be as clear as possible that Yoctopuce doesn't provide ready-to-use solutions. In the end, we decided to make a small exception:-) and to give you an application to easily visualize the values measured by Yoctopuce sensors. If you work under Windows, you will be able to display graphs, indicators, and other gadgets in a few clicks. Follow the guide...


