 Summer is coming and, with it, heat waves that put a strain on the air conditioning of server rooms. How can we know if an air conditioner is of the right size or if it labors to cool the room and risks to fail at any time? How can we know if fresh air is distributed everywhere, or if the addition of a simple air circulator could save a few KWh?
Air conditioning installers and repairmen often rely on a single thermometer on a room wall and wave their hands behind the racks to make sure that "everything is okay". Not very convincing... Ideally, we should continuously map the temperature in the room, in order to be able to localize critical areas and, above all, to see how the temperature varies depending on server load and on the external temperature.
Temperature sensors for live monitoring
To measure the temperature in several locations in the room, the most efficient method is to use thermistors, which are small, passive, temperature sensitive components. They can easily be moved away with a simple electric wire. To measure the thermistors and interpret their values as temperatures, you can simply use a Yocto-MaxiThermistor with 6 inputs. You can connect the Yocto-MaxiThermistor by USB to the computer closest to each group of 6 measuring points, or connect it directly to the local network (without touching the servers) with a YoctoHub-Ethernet.

A Yocto-MaxiThermistor with 6 thermistors
A software off-the-shelf: VisualDAQ
Then you must view and monitor the measures. For this, there is an application called VisualDAQ (developed by UnifoSys) which allows you to gather the measures taken by different sensors, to view them in real time and in color on a room map, and to set up alarms. And if we tell you about it, it's precisely because this application now supports all the Yoctopuce temperature sensors. We performed a few tests with about 50 measuring points and, at first glance, it seems to work pretty well. The application already fully supports the use of logical name to identify the sensors, and beacon support is on the way...

VisualDAQ main window
Our test
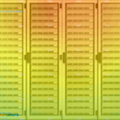
We don't have a real computing center for the demo, but we managed to build a little something. We drilled a 6x6 matrix holes in a aluminum sheet and glued a thermistor in each hole. Then we connected all the thermistors to 6 Yocto-Thermistor-C and then connected these to a YoctoHub-Ethernet and a YoctoHub-Shield. We ended up with some kind of thermal scanner, low tech but quite demonstrative.

We made a 6x6 thermistors matrix
We had quite some fun with our "thermal scanner". A soon as we place something either hot or cold on it, the heat flows become obvious. It is precise enough to show the cold produced by evaporation of a liquid. We shot a little video to show you that:
Long story short, if you need to visualise heat flows inside a room or even a enclosure, you may want to have a look at VisualDAQ, it might do the trick.

