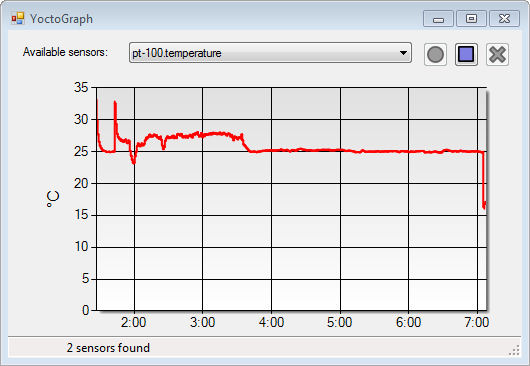
 Not long ago, tracing a dynamic graph with the values of a Yoctopuce sensor required you to have a database to store the history. Indeed, retrieving the data from the data logger was clearly too slow for an interactive application. It so happens that the data logger component of Yoctopuce products has been greatly improved, at both the API and firmware levels. Retrieving data from the data logger is now done in a flash. Demo with a C# example.
To show you how user-friendly the data logger has become, we are going to write together a short C# application that traces the data history of a Yoctopuce sensor, then updates the graph in real time. The application is quite interesting because it takes advantage of a number of features that appeared with the new API.
The YSensor class
YSensor is a new class, parent to all the Yoctopuce sensors. No need to write code specific to each sensor anymore: we can do with generic code as long as we keep to basic functions common to all sensors, such as get_currentValue, get_unit, and so on.
loadMore
Loading the data from the data logger is performed iteratively thanks to loadMore. It returns the percentage of data actually loaded and thus enables us to display a nice progression bar while loading the data.
Timed Report
We now have a new type of callback: TimedReport. When defined, this callback calls at regular intervals a function of your choice with the value of the sensor you are interested in. Very convenient to automatically update the graph.
It so happens that the .NET framework provided a Chart class, enabling you to relatively easily trace very correct graphs, with zoom management and everything. So we only need to retrieve the data from the data logger to transfer them to the .NET object. Let's have a closer look at how to do this.
Sensor dynamic inventory
In our application, we want to be able to chose between all the connected sensors. To do so, we need to build a sensor inventory which we can present to the user in a comboBox. Obviously, we want this comboBox to update itself when sensors are connected or disconnected. USB is plug-and-play, let's take advantage of this :-)
So we set up two callbacks: the first one called when a module is connected, and the second one called as soon as a module is disconnected.
YAPI.RegisterDeviceRemovalCallback(deviceRemoval);
Note that these callbacks are in fact called only when YAPI.UpdateDeviceList is executed, so we must call this function from time to time, with the help of a timer for instance.
Each time deviceArrival is called, we enumerate all the connected sensors, and we add the missing ones in the comboBox.
{ YSensor s = YSensor.FirstSensor();
while (s != null)
{ if (!comboBox1.Items.Contains(s))
comboBox1.Items.Add(s);
s = s.nextSensor();
}
}
Each time deviceRemoval is called, we check that each sensor stored in the comboBox is actually onLine, if not we remove it from the list.
{ for (int i = comboBox1.Items.Count - 1; i >= 0; i--)
if (!((YSensor)comboBox1.Items[i]).isOnline())
comboBox1.Items.RemoveAt(i);
}
This is it for dynamic inventory.
Extracting the data from the data logger
Extracting the data is a three steps process:
- We ask the API to load the data from the data logger. To do so, we use the loadMore function of the DataSet returned by the get_recordedData function of the sensor. We call this loadMore function in a loop, it very conveniently returns the percentage of data already loaded, enabling us to update a progression bar.
- At this point, all the data of the data logger have been transferred from the module to the computer, but they are still somewhere in the shallows of the API. We then use the get_measures() function to transfer them into a C# list.
- Finally, we only need to transmit these data to the graph.
YDataSet data = s.get_recordedData(0, 0);
//data loading
int progress = data.loadMore();
while (progress < 100)
{ progressBar.Value = progress;
Application.DoEvents();
progress = data.loadMore();
}
//transfer into an array
List<YMeasure> alldata = data.get_measures();
// sending the data to the graph
for (int i = 0; i < alldata.Count; i++)
{ DateTime t = UnixTimeStampToDateTime(alldata[i].get_endTimeUTC())
chart1.Series[0].Points.AddXY( t, alldata[i].get_averageValue());
}
// displaying the units
chart1.ChartAreas[0].AxisY.Title = s.get_unit();
Real time updating
To update the graph in real time, we use the brand new callback TimedReport. This callback, which you can configure independently for each sensor, enables you to call the function of your choice with the value of the sensor.
s.set_reportFrequency("3/s"); // 3 times per second
s.registerTimedReportCallback(newSensorValue);
Beware, the TimeReport callback is called only when YAPI.Sleep or YAPI.HandeEvents is executed. So you must call one of these functions from time to time. Using a timer is ideal for this.
The callback, meanwhile, is really simple. It only adds to the graph the measure received as a parameter.
{ DateTime t = UnixTimeStampToDateTime(m.get_endTimeUTC());
chart1.Series[0].Points.AddXY(t , m.get_averageValue());
}
Here we are, we discussed the Yoctopuce code enabling you to trace a graph of a sensor history thanks to the data in the data logger and to keep this graph constantly up to date. The whole project is available here. It will be part of the C# library examples at the next release.

A graph tracing application, written in no time
Naturally, for this application to work, you need your Yoctopuce library and firmware to be up-to-date. They are still in beta-test, but you can download them here.


