![]() This week, we added support to the YoctoHubs and VirtualHub for a new monitoring and graph system, which is of particular interest to system engineers: PRTG. From now on, no more excuse for not detecting air conditioning failures before the servers crash :-)
This week, we added support to the YoctoHubs and VirtualHub for a new monitoring and graph system, which is of particular interest to system engineers: PRTG. From now on, no more excuse for not detecting air conditioning failures before the servers crash :-)
For a system engineer responsible for the proper functioning of an IT infrastructure, it is essential to have at all times a holistic view of one's system parameters: service status, load, alerts, and so on. The multi-platform forerunner tool in this domain was MRTG (Multi Router Traffic Grapher), which enabled you to monitor any type of device with an SNMP entry point.
Among alternatives to MRTG, more modern and user-friendly, there is PRTG, which has a plugin architecture allowing you to monitor many more things, including virtualization resources or decentralized infrastructures (Cloud). PRTG also supports aggregation in push mode, of the type we use for our HTTP callbacks. We were thus able to add a data format compatible with PRTG, in order for our YoctoHubs to directly post environmental measures on a PRTG server, without requiring any other computer.
You can find below all the steps for setting up monitoring of the temperature and humidity in a server room with PRTG and a Yocto-Meteo. We could naturally complete the system with a measure of the mains voltage or of CO2, for example.
PRTG configuration
To begin, you need to install PRTG on a Windows server, or if you prefer to skip that step, contract a PRTG hosting from a provider such as Hibouvision.
In the Devices menu, select Add Device. As an anchor point, use the Local Probe node, corresponding to the measure server installed on the machine where you installed the PRTG interface:

The Local Probe node
Then give a name to your Device, which will enable you to easily recognize it, and enter its network name if it has one, or its IP address otherwise. Note that this address is not used normally as it is the YoctoHub which contacts the PRTG measure server, and not the other way around.
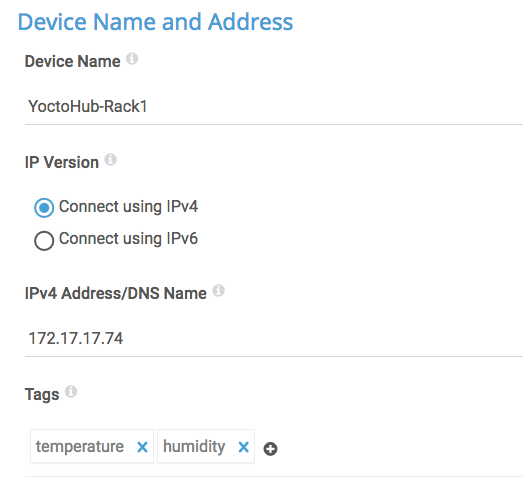
Device parameters
You can also add tags and an icon to recognize you module more easily. Leave the other settings on their default values, in particular keep the no auto discovery option, and confirm the creation of your Device.
At this point, a new node should have appeared at the bottom of your sensor tree, as in the following example:

The new node
Click on the Add Sensor link to configure the measure acquisition method. The page that opens lists a wide variety of available methods. To find the one we are interested in, type Push in the search field. This will make the sensor type called HTTP Push Data Advanced more visible as you must select it.
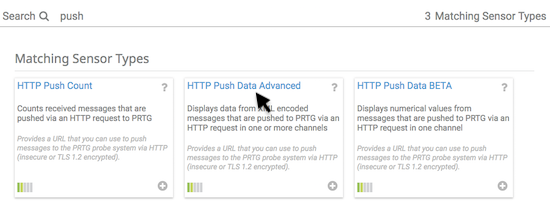
HTTP Push Data sensors
You can give a name to this sensor, representing in fact a measure acquisition method. We are going to call it HTTP Callback. Among the parameters that you can configure, two are important: the TCP port which you must use to post the data (by default 5050) and the Token which enables the attribution of data to this specific sensor. The standard behavior is to give a random GUID, but you can decide on an arbitrary identifier. We use here the word SecretToken
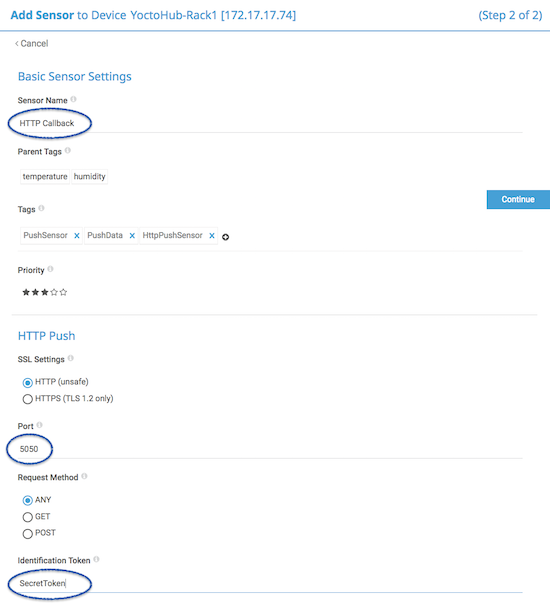
Settings of the Push Data sensor
When your PRTG infrastructure is ready to receive measures sent by Yoctopuce sensors, you need to tell the YoctoHub where to post its data.
Configuring the YoctoHub (or VirtualHub)
After installing a recent firmware, open the HTTP callback configuration window of your YoctoHub and configure it as follows:
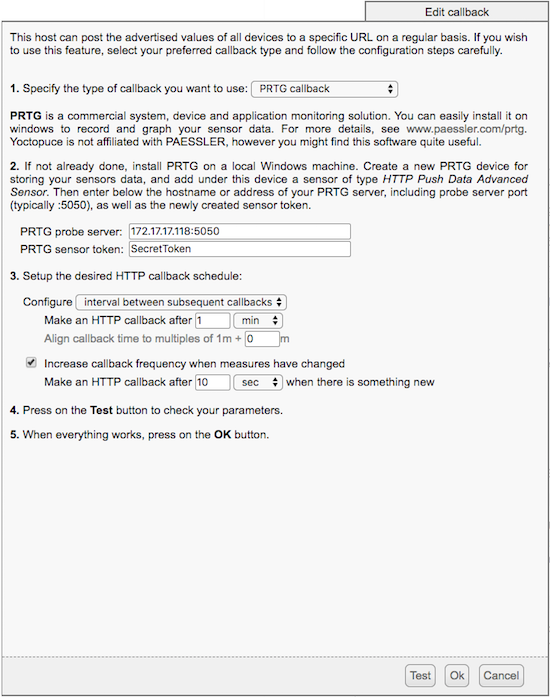
YoctoHub configuration
By pressing the Test button, you can make sure that the HTTP callback to PRTG works correctly:
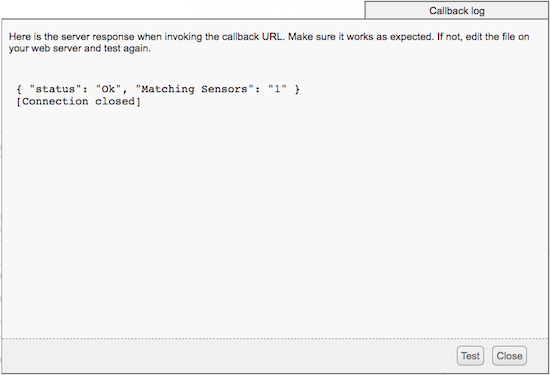
Test of the PRTG callback
If you go back on the PRTG console, you notice that your sensor became green, because the first data have reached it.
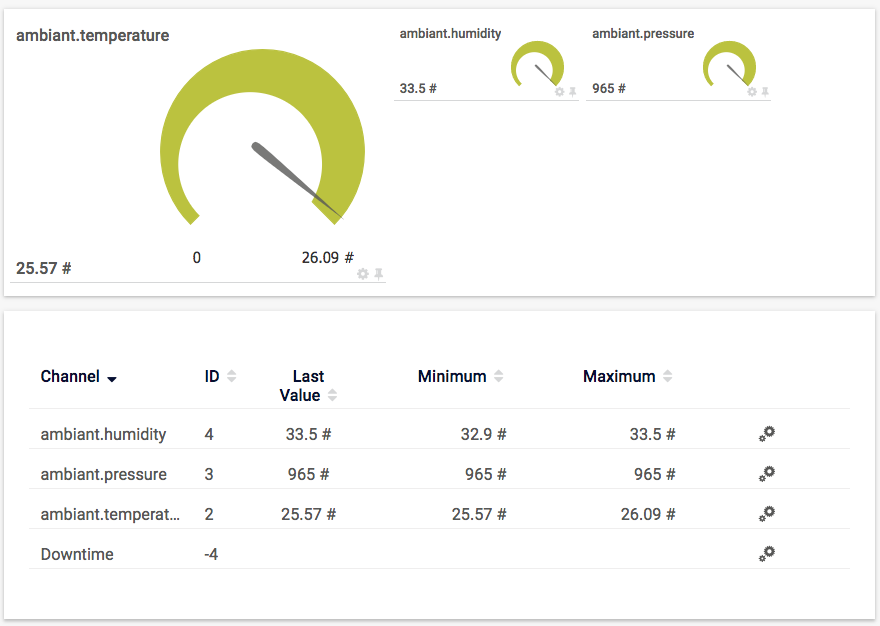
The first data arrived
To facilitate reading, you can at this stage click on each of the measures to configure the corresponding unit that must be displayed. Thus, you can more easily recognize the measures, in particular on the graphs.
Conclusion
It's now easy to monitor the environmental parameters jointly with system data by using PRTG. You thus automatically benefit from the warning mechanisms available in this infrastructure.
Moreover, if you use a YoctoHub-GSM and a PRTG infrastructure hosted by a service provider, you can go on receiving environmental warnings and measures such as the mains voltage even in case of total failure of the network connection in your infrastructure... Not bad, eh?


