![]() The Yocto-Visualization (for web) application has been coded to be as similar as possible to the native version. However, there are some differences. This week, we propose to discuss them.
The Yocto-Visualization (for web) application has been coded to be as similar as possible to the native version. However, there are some differences. This week, we propose to discuss them.
Without further ado, let's get to the heart of the matter and list these differences.
Windowing system
This is probably the most obvious difference. While the native version relies on the windowing system of the host operating system, the web version has its own windowing system in the browser window. In Yocto-Visualization (for web), the configuration windows cannot be moved or resized... With the exception of the property editor.
By default, the latter is stuck on the right side and occupies the whole height of the browser, but it is possible to change its side by clicking on the ⇤ icon in the window banner.
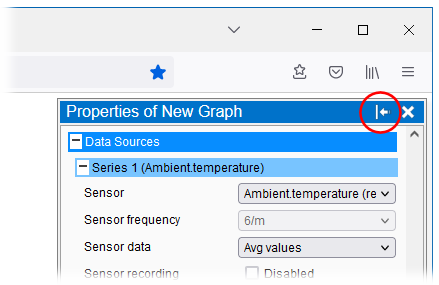
You can move the property editor from one side to the other
Unlike windows, widgets can be moved and resized. Once you have placed a widget in edit mode, you can either use the arrow icons that appear on the widget or enter numerical values for size and position in the Window section of the properties editor.
Relative size
To mimic the behavior of the native version, the size and position of the widgets are specified by default as absolute values. But as it is unlikely that the size of the browser displaying Yocto-Visualization (for web) will be the same every time, it is also possible to set the position and size of the widgets relatively. If, in the Window section, you set the Rel. size and pos. option, then the position and size of the corresponding widget is treated as a percentage relative to the size of the web browser window.
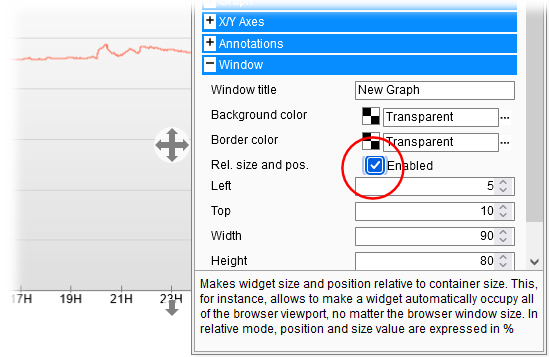
The size and position of the widgets can be defined in a relative way
For example, if you want the widget to be centered in the middle of the page you can use the following relative values:
- left=10%
- top=10%
- width=80%
- height=80%
No native USB
Yocto-Visualization (for web) does not have direct access to the USB ports of the machine on which it runs, and that's good. Who wants an arbitrary web site to access their USB devices? To use Yoctopuce modules connected to the local machine, you have to run a VirtualHub and add its address 127.0.0.1, port 4444 in the list of hubs that Yocto-Visualisation (for web) must use.
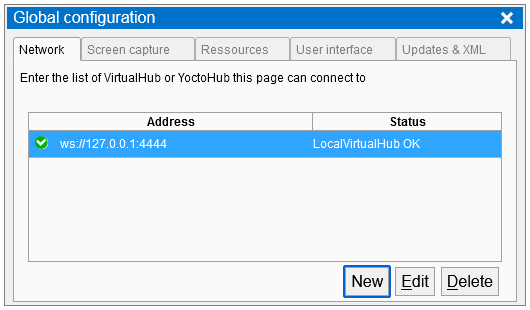
Use a VirtualHub to access local modules
Saving
The native version of Yocto-Visualization automatically saves its configuration when you quit the application. For the web version, it was not possible to do the same when the user leaves the web page displaying the application, at least not in a reliable way. It is therefore up to the user to remember to save after a modification. To help the absentminded, Yocto-Visualization displays a floppy disk icon at the top left of the screen to indicate that a modification has been made, just click on it to save.
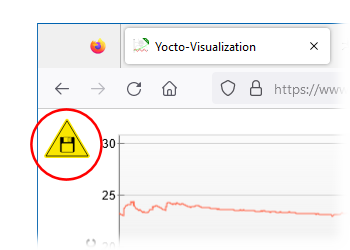
Don't forget to save
Password management
Yocto-Visualization configuration is stored in an XML file. These XML files are compatible between the two versions, you can perfectly export the configuration file of one version to import it in the other one... Except for the passwords used to access the hubs.
For technical reasons, the two versions encode passwords differently. If you import from another version a configuration file containing passwords, you need to redefine them in the "global configuration" interface.
About passwords
The passwords for accessing the hubs are encoded in the configuration file. That's why we recommend you to store only "user" passwords in the Yocto-Visualization (for web) configuration. If Yocto-Visualization (for web) needs the "admin" password to save its configuration on a hub's file system, it will realize this and ask you for it in due course.
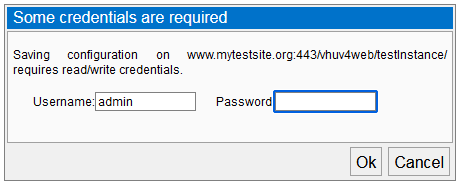
If needed, the application will ask you for a Read/write login, aka 'admin', to save
Data logger management
The native version of Yocto-Visualization tries to load the data logger content of all the sensors it detects, the idea being to be able to display the data as quickly as possible when needed. We quickly realized that this method was not very reasonable when Yocto-Visualization (for web) is installed on a VirtualHub (for web) instance because such an instance can very easily contain dozens of sensors, each with a data logger that can contain months of data. Attempting to load the contents of all these data loggers in parallel when starting the application can quickly become a problem, especially on low-powered machines such as tablets. That's why from version 52602 Yocto-Visualization (for web) loads the content of the data loggers only when it needs it.
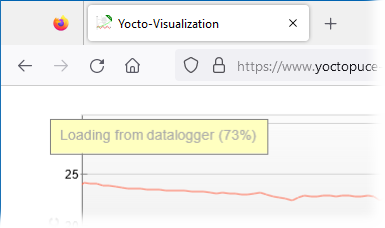
The content of the data loggers is now loaded on demand
Interface size
Since Yocto-Visualization (for web) runs in a web browser, it can be used on a wide variety of hardware, from desktop to cell phone to tablets. This means that it can be displayed on screens with very different densities. That's why Yocto-Visualization (for web) tries to automatically adapt the size of the interfaces and especially the texts so that they remain readable without taking up too much space. However, detecting by software the density of a screen is far from being an exact science. That's why Yocto-Visualization (for web) also proposes to manually define in the global configuration the zoom factor to use for the display. This setting is stored as a cookie in your browser and is therefore specific to the browser and server serving the Yocto-Visualization (for web) application.
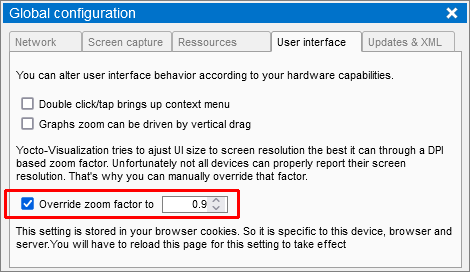
You can set the zoom level manually
Screenshots
Just like the native version, Yocto-Visualization (for web) is able to take screenshots in both PNG and SVG formats, but these screenshots appear as downloaded files in your web browser. Yocto-Visualization (for web) is not able to place these screenshots directly on the clipboard.
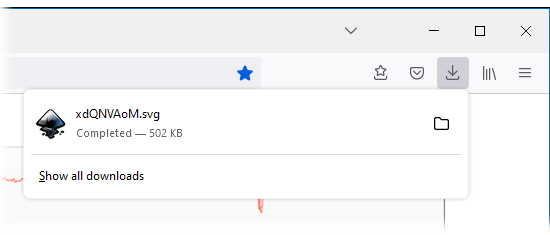
The screenshots appear in the downloads section of your web browser
Alerts
The native version provides two configurable alerts per sensor that can execute the system command of your choice when triggered. Of course, you can't do that with the web version. Instead, you can execute a line of JavaScript. This could be useful if you run Yocto-Visualization (for web) in your own web page.
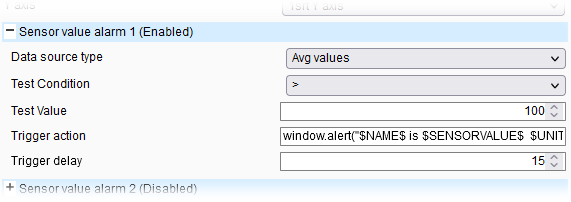
Alerts execute JavaScript code
Conclusion
We have covered the essential differences between the native and web versions of Yocto-Visualization. As a conclusion here are some useful links:
- The presentation of Yocto-Visualization (for web).
- How to use the native version.
- Integrating your own web page in Yocto-Visualization (for web).
- Integrating Yocto-Visualization (for web) in your own web page
- Adding series in Yocto-Visualization (for web).
- Web page, Yocto-Visualization, and actuators.


