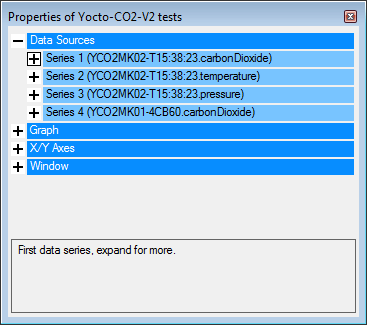
![]() Customers have asked us several times why Yocto-Visualization offers only 4 data series per graph and whether it is possible to have more. The explanation is simple: we had to choose a limit, and a maximum of 4 seemed reasonable. Nevertheless, it's rather easy to modify the application to have more series, and this week we show you how to do so.
Customers have asked us several times why Yocto-Visualization offers only 4 data series per graph and whether it is possible to have more. The explanation is simple: we had to choose a limit, and a maximum of 4 seemed reasonable. Nevertheless, it's rather easy to modify the application to have more series, and this week we show you how to do so.

What do you mean? Four series aren't enough?
You probably think that it would be simple to define the maximum number of series per graph as a constant that the user could configure in the application, and everyone would be happy. It's a bit more complex than that, because of the way these series are described in the source code. You are going to understand...
Setting up
Adding series into Yocto-Visualization requires a slight modification of the source code. To do so, you therefore need:
- VisualStudio, minimum 2015, the basic version is available free of charge on the Microsoft web site.
- The source code of Yocto-Visualization, available on GitHub, also free of charge.
The modification that you must perform
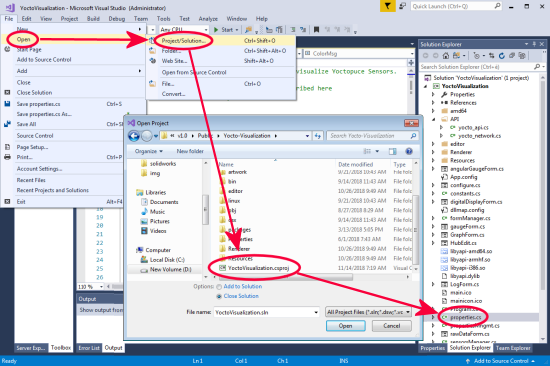
When VisualStudio is installed and the source code copied on your computer, open the YoctoVisualization.csproj project with VisualStudio. Open the properties.cs file by double-clicking on it in the solution explorer window.

Open the properties.cs file
Around line 2200 of the properties.cs file, you find the definition of the first series:
[ DisplayName("Series 1"),
CategoryAttribute("Data Sources"),
PreExpandedCategoryAttribute(true),
PreExpandedAttribute(true),
ReadOnlyAttribute(true),
DescriptionAttribute("First data series, expand for more.")]
public ChartSerie Graph_series0
{
get { return _Graph_series0; }
set { _Graph_series0 = value; }
}
followed by the definition code for the second series:
[ DisplayName("Series 2"),
CategoryAttribute("Data Sources"),
ReadOnlyAttribute(true),
DescriptionAttribute("Second data series, expand for more.")]
public ChartSerie Graph_series1
{
get { return _Graph_series1; }
set { _Graph_series1 = value; }
}
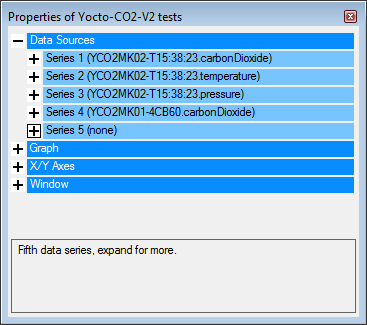
and so on for series 3 and 4. To add a fifth series, you only need to add its definition right after that of _Graph_series3, making sure to respect the numbering logic.
[ DisplayName("Series 5"),
CategoryAttribute("Data Sources"),
ReadOnlyAttribute(true),
DescriptionAttribute("Fifth data series, expand for more.")]
public ChartSerie Graph_series4
{
get { return _Graph_series4; }
set { _Graph_series4 = value; }
}
Note that the color, here Color.Orange, used as parameter when instantiating, is used to define the default color of the series. When the modification is performed, compile the project (F6). You can then find in the bin/debug directory an executable able to manage 5 series. You can add as many series as you want, but expect the rendering speed of the application to be inversely proportional to the number of displayed series.

Adding a fifth series? too easy!
Conclusion
The maximum number of series that the Yocto-Visualization can manage is not dynamic and cannot be configured directly in the user interface, but modifying the source code to add series takes less than two minutes. The properties.cs file was designed to make this kind of modifications as easy as possible. For example, you can also add vertical axes in exactly the same way: you only need to add some Graph_yAxesxx.


