 As the Yocto-Visualization application is very successful with our customers, we keep improving it, naturally by fixing bugs, but also by adding new features. These new features come up regularly, but they are not advertised: one must usually read the release notes to know what each new version brings. This week, we sum up key changes that have occurred over the past year.
New property editor
The Yocto-Visualization widgets configuration relies on a property editor that enables you to modify almost any parameter: sensors to use, colors, fonts, sizes, and so on. At the beginning, we used the property editor provided by default in VisualStudio. But on the long run, we noticed that it raised many ergonomic questions and that didn't work well under Linux. So we wrote one from scratch. The new editor presents the parameter hierarchy in a much clearer way and it can even tell you if the entered parameters are incorrect, such as a negative font size for example.
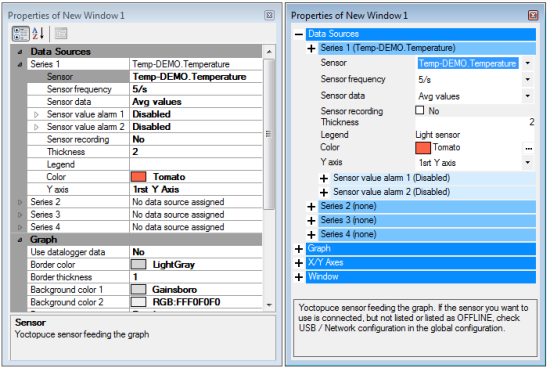
The property editor, before/after
Export SVG
The first version of Yocto-Visualization 2 could export the content of the different widgets in the PNG format. More recent versions can also export these contents in the SVG format, that is a vectorial format. You can thus obtain graphs that you can resize and include in your documents without loss of resolution. You can select the export type in the global configuration, under the "screen capture" tab.
Export in vectorial mode (SVG). You can zoom in like crazy, it won't pixelize.
Retrieving missing data
When a sensor appears for the first time in Yocto-Visualization, the later can retrieve its data in the corresponding module data logger. From now on, Yocto-Visualization tries to use the data logger each time the module appears, and not only the first time. Thus, if you use a network connected sensor and the network is down, you'll see the missing data appear as soon as the connection is back on. Obviously, for it to work, you need your sensor to be configured to use the data logger and you need it to be powered at all times.
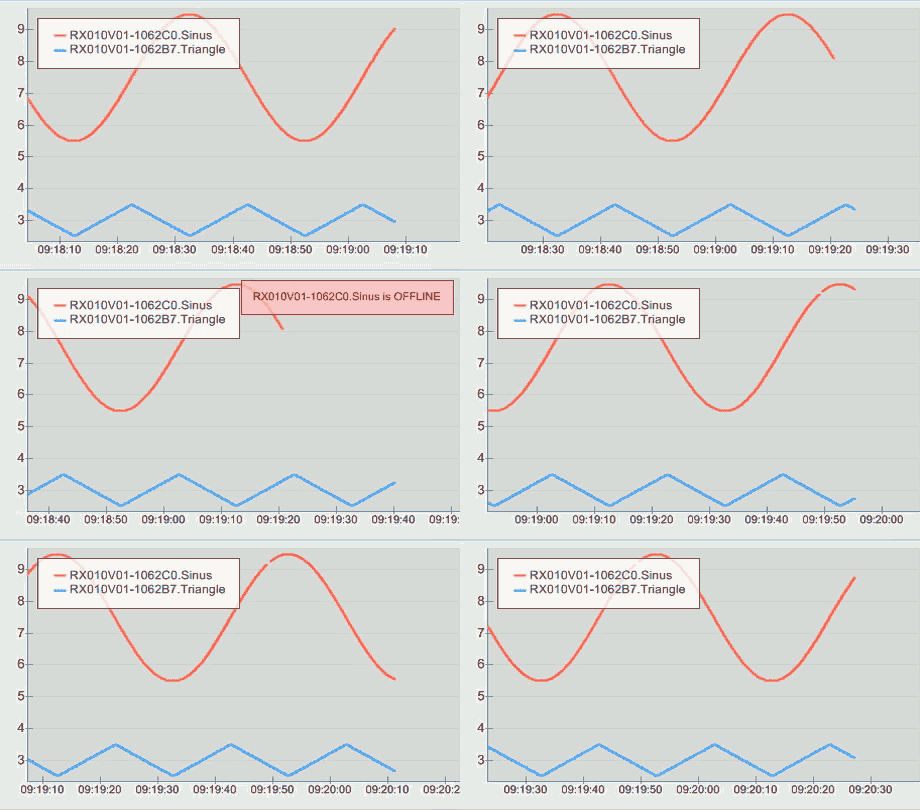
Missing data are automatically retrieved from the data logger
Minor improvements
There are also a host of small details that have been modified as we noticed the problems while using the application.
Legends
By default, the line displayed in the graph legend is of the same thickness as the one defined for the plotting. But we noticed that it was difficult to distinguish the colors well enough in the legend when the lines were too thin. The "Legend panel" section now includes a parameter called "Color indicator factor" enabling us to thicken these lines.
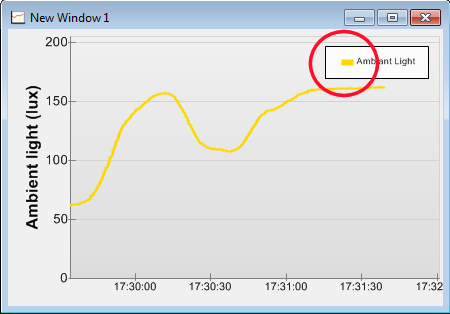
We can now change the line thickness in the legends
Save now
Yocto-Visualization automatically saves all of its configuration each time it is closed. But we noticed that it wasn't very convenient to close and reopen the application to make sure that everything was saved, so we added an explicit "Save now" button in the menu.
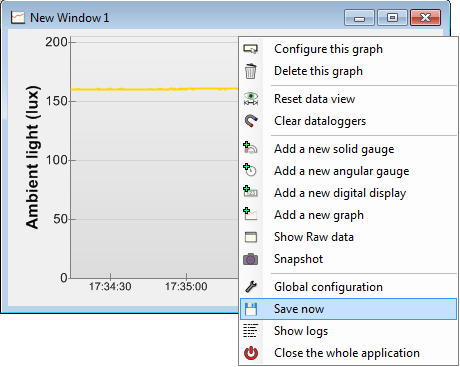
Yeah, right, we should have done that from the start
Read-only
Yocto-Visualization is now able to notice if a sensor can only be accessed in read-only mode. In fact, YoctoHubs can protect the modules connected to them against writing. If a sensor is read-only, the "Sensor frequency" and "Sensor recording" parameters are then greyed in the property editor, because modifying these parameters modifies the configuration of the corresponding module.
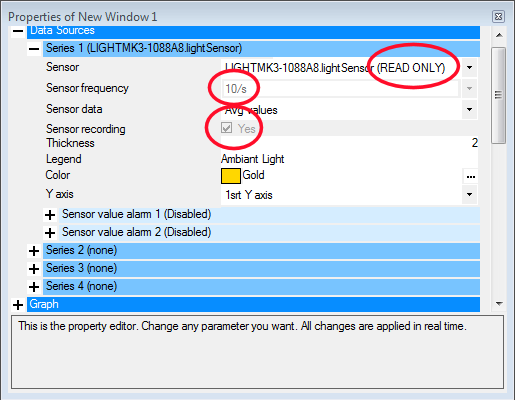
Read-only sensors are detected
Zoom and right-click with a touchscreen display
As you call the configuration menu with a right-click, we soon noticed issues with machines offering only a touchscreen display. In the global configuration, under the "user interface" tab, you can ensure that a double tap calls the configuration menu. However, if you have numbers to enter in the configuration editor, you still need a keyboard. You can also configure the application to control the zoom level with vertical drags.
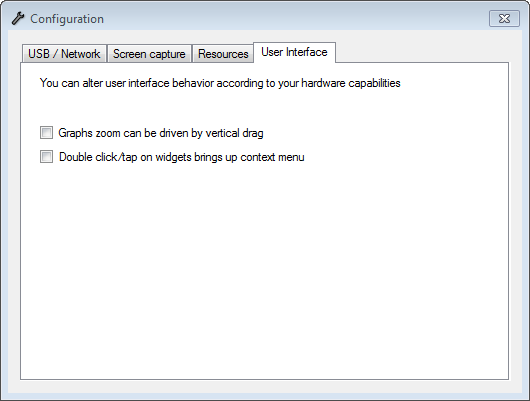
You have a touchscreen display and no mouse? Don't worry!
Removing phantom peaks in plots
Lastly, we finally corrected a defect in rendering which made phantom peaks appear in very dense graphs with a strong zoom out.
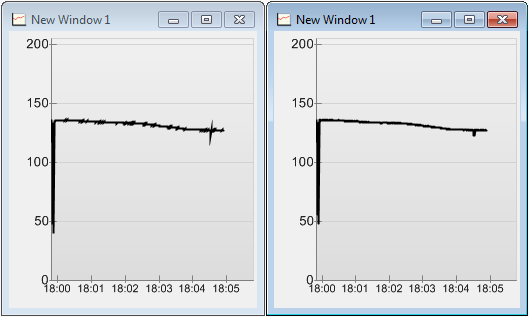
No more phantom peaks, before/after


