 This week we have built a small test bench to determine the autonomy of several bike lights. This post, quite short, aims to show you how to build this bench very quickly using Yoctopuce modules.
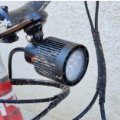
The objective of this test bench is to check the actual autonomy of different bike lights. We used a Yocto-Light-V3 placed 50 cm in front of the light. By placing this system in a poorly lit place, such as a cellar, we can very easily detect when the lamp is on or off. As the Yocto-Light-V3 has a large enough measuring range, it is not saturated by the light and we can even compare the power of different lights. The absolute measure is not very relevant, because optics and beam shape are more important in real use, but it is always interesting to be able to compare the raw power of the different lights.
We also added a Yocto-Temperature which measures the ambient temperature, and allows us to see the impact temperature has on the autonomy of the light.
We connected these two sensors to a YoctoHub-Wireless-n. And thanks to the data loggers of the modules and to Yocto-Visualization (for web), we don't need a computer during the experiment.

Setting up the experiment
Graph
The purpose of this test bench is to obtain a graph with the Lux measured by the Yocto-Light-V3 on the Y axis and the time on the X axis. We also display the ambient temperature on a secondary axis. This graph allows us to determine afterwards the real autonomy of the light.

The graph of the experiment
To generate this graph, we used our new tool Yocto-Visualization (for web) which is installed directly on the YoctoHub-Wireless-n.
Installation
The easiest way to install Yocto-Visualization (for web) is to connect to the YoctoHub web interface and to access the control panel. Since firmware 52200, all YoctoHubs have a button to start the Yocto-Visualization (for web) installer. If this button is not present on your YoctoHub, you simply have to update the firmware of your YoctoHub. Be careful, depending on your network, the first step which consists in downloading Yocto-Visualization (for web) can be very long (about several minutes).
When Yocto-Visualization (for web) was installed, we created a new graph with our two series corresponding respectively to the light sensor of the Yocto-Light-V3 and the temperature sensor of the Yocto-Temperature. The frequency was set to 12 measures per minute. We also configured the axes of the graph and the names of the series.
By default, Yocto-Visualization displays the values that are sent by the sensors, but these data are not stored anywhere. If you close the web browser window, the data is lost :-(
To solve this problem, you need to activate the Sensor recording option for each series. This option has two effects. The first is to activate the data logger of the sensor so that the measures are automatically recorded in the flash memory of the module. The second is to load and display the measures that have already been recorded in the data logger. Thanks to this option, we can close our web browser and reopen the graph later, without losing any measure.
The last option we have activated is the export format of the graphs. By default, Yocto-Visualization exports the graph snapshots in PNG format. But in the global settings of Yocto-Visualization, it is possible to change this format to export the graphics in SVG. In our case, the latter option is preferable, as it allows us to generate several images at different resolutions using our favorite graphics software.

The result of a light

The result of another light
Conclusion
In the end, in a very short time, we were able to build a test bench for bike lights. The graphs that we obtained with this test bench allow us to compare the autonomy of the lamps as well as to see the impact of the ambient temperature. Moreover, the system is autonomous and does not require a computer to record the measures.

