![]() Almost all the Yoctopuce sensors are equipped with a data logger. We already wrote on this subject several times, but this week we give you an overview in the framework on our for the beginners series. Follow the guide...
Almost all the Yoctopuce sensors are equipped with a data logger. We already wrote on this subject several times, but this week we give you an overview in the framework on our for the beginners series. Follow the guide...
The data logger embedded in the Yoctopuce sensors allows you to record independently each of the functions of the module. You can configure the logging frequency from 1 entry per hour up to 100 entries per second. For recording frequencies above 1Hz, the data logger records only instant values, while for frequencies below 1Hz, recorded values are the average value, the maximum value and the minimum value for each period.
About size
Values are recorded in a loop: when the data logger memory is full of data, the oldest ones are written over. The exact capacity of the data logger is never formally documented because it has a slight tendency to change depending on the production date of each module and on the firmware version that is used.
Depending on the modules, some parts of the firmware are stored on the module flash memory, thus slightly diminishing the space available for the data logger. But above all, the flash memory market fluctuates a lot: usually, capacity increases and price decreases as time goes on. Therefore, the first Yoctopuce modules manufactured seven years ago had only an 8Mbits memory, while today we use 32Mbits memories for a similar cost. For a while, we were even able to manufacture modules with 64Mbits memories before the manufacturer got bought by a larger fish, which unfortunately decided to cease production.

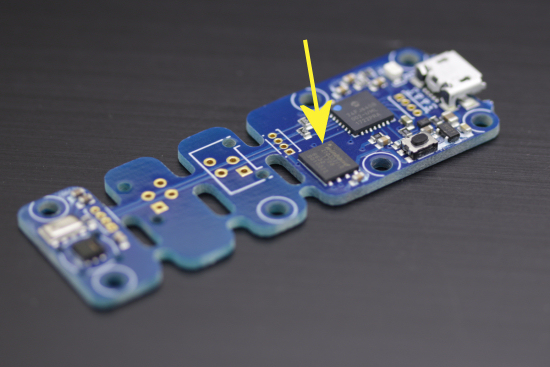
The data of the data logger are stored in this component
To know the size of your module flash memory, consult the module log with the VirtualHub. In short, if you bought your module in 2014 or later, you can be sure to store at least half a million values in your data logger memory.
Configuring and triggering the data logger
There are several ways to exploit the data logger embedded in your module.
The VirtualHub
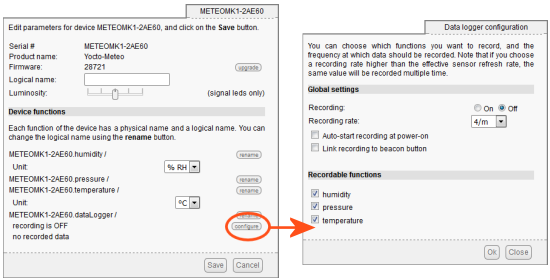
Recent versions of the VirtualHub propose a simple interface to configure and trigger the data logger. It enables you to select the functions to be recorded and the recording frequency. You can also use it to configure the data logger to start recording automatically at module power on, or when the Yocto-Button is pushed.

VirtualHub: The data logger control interface
Note that to keep it simple, this interface doesn't allow you to configure different recording frequencies for different functions, although the data logger is able to do so.
The command line API
The command line API allows you to precisely configure the recording of each function. Let's imagine that we have a Yocto-Meteo with serial number METEOMK1-2AE60 and that we want to record the temperature every 15 seconds, the configuration command is
YTemperature METEOMK1-2AE60.temperature set_logFrequency 4/m
Then to start the data logger, you must type
YTemperature METEOMK1-2AE60.temperature startDataLogger
Note that this triggers recording for all the functions of the modules for which the logFrequency parameter is not set to "OFF". Indeed, this call is strictly equivalent to
YDatalogger METEOMK1-2AE60.datalogger set_recording ON
The coding
As with all the other features of Yoctopuce modules, you can naturally control the data logger by programming. Here is a piece of code in Python which configures the logging frequency and triggers the data logger. The calls are similar in other languages.
t.set_logFrequency("4/m")
t.startDataLogger()
Stopping the recording
There are two ways to stop the recording, either by setting the recording frequency of the desired function to "OFF", or by stopping the data logger, but in this case it stops recording all the other functions as well. To do so, there are several possibilities:
The VirtualHub
Still from the data logger managing interface, set the recording parameter to OFF.
The command line API
From the command line, you can act on a single function or on the whole data logger.
YTemperature METEOMK1-2AE60.temperature set_logFrequency OFF
or
YTemperature METEOMK1-2AE60.temperature stopDataLogger
The coding
To do the same in Python or with any of the other programming languages, you can write:
t.set_logFrequency("OFF")
or
t.stopDataLogger()
Retrieving the data
Obviously, at one time or another, you will need to retrieve the logged data. Here as well, you have three main ways to do so.
The VirtualHub
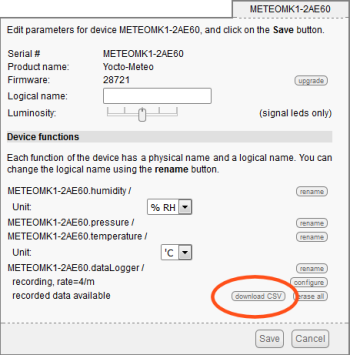
In each module configuration window, there is a section called datalogger which enables you to download the logged data in CSV format as soon as they are available. Note that you will thus obtain the data as a whole, for all the functions.

VirtualHub: retrieving the data
The command line API
You can naturally retrieve the data through the command line API. The get_recordedData command does that very well. It takes two parameters: startTime and endTime which are UNIX timestamps corresponding to the beginning and end dates of the data that you want to retrieve. Use 0 0 to retrieve the complete set of data. Here is an example displaying the content of the data for the temperature function:
YTemperature METEOMK1-2AE60.temperature get_recordedData 0 0
If you'd rather have them in CSV format, add a "-c"
YTemperature -c METEOMK1-2AE60.temperature get_recordedData 0 0
The coding
Retrieving the data logger data by coding is perhaps one of the most complex tasks that can be performed with the Yoctopuce API. Don't worry, nothing too bad. The issue comes from the fact that it's a rather slow process, we'll get back to this, so the retrieval happens incrementally: no one likes to see a completely frozen application because it's doing input/output operations.
- First, you must call the get_recordedData function with the start and end timestamps of the retrieval period; or 0,0 to retrieve everything. This call returns an object of the YDataset type which is used for the rest of the process.
- Then, you must call at least once the loadMore() method of the YDataset object.
- At this time, you can already call the get_summary() method which gives you a YMeasure object summarizing the content of the data logger; or even get_preview() which returns a foretaste of the data logger content in the form an array of YMeasure objects summarizing the content at the rate of about one element for 120 to 250 recordings.
- To retrieve the remainder of the data logger, you must then call loadMore() in a loop. Each call returns the percentage of already retrieved data. You must therefore stop when this value reaches 100.
- Finally, the call to get_measures() enables you to retrieve all the measures in the shape of an array of YMeasure objects.
dataset = t.get_recordedData(0, 0)
dataset.loadMore()
summary = dataset.get_summary()
progress = 0
while progress < 100:
progress = dataset.loadMore()
details = dataset.get_measures()
Extracting data from a YMeasure object is quite simply trivial:
print("from %s to %s : min=%.3f%s avg=%.3f%s max=%.3f%s" % (
m.get_startTimeUTC_asDatetime().strftime(fmt),
m.get_endTimeUTC_asDatetime().strftime(fmt),
m.get_minValue(), t.get_unit(),
m.get_averageValue(), t.get_unit(),
m.get_maxValue(), t.get_unit()))
Note that the data retrieval process is rather slow. It's a side effect of one of the main qualities of the Yoctopuce modules: the absence of driver. In order to avoid using specific drivers, all of the Yoctopuce modules work in USB 1.1 and use a HID protocol, of the same type as the one used by keyboards and mouses. Thanks to this, Yoctopuce modules are really plug-and-play: you connect them and they immediately work. The downside is that the maximum transfer rate is, in the best case, 64KB per second. So if you have several megabytes of data to retrieve from a data logger, expect it to take some time.
Erasing the content of the data logger
Erasing the content of the data logger is relatively trivial. You need only one click in the VirtualHub or a simple call in the command line or in the API.
YTemperature METEOMK1-2AE60.datalogger forgetAllDataStreams
d = YDatalogger.FindDatalogger('METEOMK1-2AE60.datalogger') d.forgetAllDataStreams()
To conclude
You now know everything you need to start with the data loggers of the Yoctopuce modules. To conclude, a few more general comments:
- Don't set the recording frequency higher than what you need for your application. Firstly, you'll find yourself with a heap of data particularly difficult to manage. Secondly, it is quite useless to record faster than the sampling speed of the sensor.
- If you work in HTTP callback mode, you can without trouble send commands to the data logger, but you can't retrieve data stored in it. On the opposite, this works with WebSocket callbacks.


